Background
The United States Agency for International Development (USAID) believes that universal health coverage (UHC) is achieved by high performing health care (HPHC) (PDF, 595 KB) especially in low- and middle-income countries.
Key contributions of the tool to health system strengthening:
- Broadens the understanding of UHC. It is not only about increasing coverage or reducing financial barriers to avoid impoverishment, but also addressing social values.
- Provides a comprehensive picture of the health system at a given point.
- Contributes to measurement of health system performance by assessing functionality of the health system processes that are imperative for better performance.
HPHC Uniqueness
The High Performing Health Care framework emphasizes that health care is high performing only if it is accountable, affordable, accessible, and reliable (AAAR), and that these characteristics are present across society for all populations who need healthcare, especially those in vulnerable situations. Within each of these broad characteristics of high performing health care lie processes that address geographical, financial, cultural and health system barriers to health care faced by the community. For example; the accountable and reliable characteristics of health care are explicit that the health system is the owner and organizer of health care but also, that it is responsible for assuring health care is available when people need it and can afford it without undue burden. High performing health care acknowledges the health system’s dual role of supplier and demand generator for health services. The framework also recognizes the community’s critical and dynamic relationship with the health system as consumer, advocate, and overseer to assure that community health needs are met. To that end, the full set of processes that make a health system accountable, affordable, accessible, and reliable will also enable it to achieve Universal Health Coverage.
USAID’s High Performing Health Care framework focuses on the capability and the processes that make health care accountable, affordable, accessible, and reliable. Attention to the processes necessary to achieve UHC helps to break down silos created by focusing specifically on health system functions (or building blocks) and demonstrates the interdependencies among them. For example, the framework operationalizes accessible health care with multiple sub-attributes such as whether health facilities are within geographical reach and adequately staffed and equipped, as well as whether the community has access to alternate options of care beside facilities such as community or outreach workers, pharmacies, eHealth, etc. Similarly, access barriers are understood to include availability of specific types of care including emergency care or transport, as well as whether care is of high quality and respectful. Additionally the tool recognizes that community based knowledge on why, when, and where to seek care can also be a barrier or enabler to access. Through these different dimensions, the framework makes health providers responsible for equitable health outcomes in different community groups. The HPHC framework has similarly operationalized the affordable, accountable and reliable attributes.
Added Value
The HPHC framework’s emphasis on capability and processes and its measurement through the HPHC tool will contribute to the field of health systems by:
- Identifying major HPHC processes and their levels of functionality;
- Placing the locus of control for change within the health system;
- Empowering communities by highlighting the dynamic relationship for joint actions and mutual accountability for better health outcomes;
- Creating opportunities for continuous improvement;
- Testing hypotheses about AAAR and their sub-attributes absolute and relative contribution on health system outcomes;
- Providing space to innovate ways to design, manage, monitor, evaluate and research health system strengthening and contribute to the state of the art knowledge.
HPHC Tool
The complete tool is available here. Please note that all organizations interested in implementing the tool should first register to receive their unique link to send to participants.
HPHC Tool Reliability and Validity
The HPHC tool has undergone rigorous review and testing to validate its approach and effectiveness.
- The tool was validated as appropriate and relevant by health systems experts working in LMICs.
- The tool was found to be internally consistent and a valid approach for data collection through a pilot test with 213 respondents. This pilot also confirmed alignment of the tool’s results with measures collected through other data sources.
- The use of people’s perceptions as the primary source for data collection was affirmed through the literature and its use in other data collection tools, primarily in the governance sector. The tool accounts for potential perception bias by including anonymity, instructions to be truthful and adding respondents’ characteristics to check and control for biases during analyses.
Modality of use
HPHC is a web-based tool, which can be shared with many people in different locations. The tool improves representation and solves issues of cost and frequency of data collection, facilitating monitoring progress at low cost.
HPHC can be applied through different modalities such as convenience or probability sampling. The convenience sampling using key informants, or the Delphi technique provide reliable data especially if all stakeholders are represented (see Appendix B for details). The tool could be used in a survey using probability sampling such as small sample size lot quality assurance sampling (LQAS) for overall estimate of HPHC scores (see Appendix C for details). LQAS could also be used to assess if the country/region/district is meeting HPHC's predetermined level of performance.
Language
The HPHC website is available in English, French, Spanish, Malagasy, Portuguese and Indonesian. To change the language displayed, click either English, French, Spanish, Malagasy, Portuguese or Indonesian in the top right corner of any screen on the website.
Eligibility to Use Tool
Any organization (public, private, non-government organization, civil society, international organizations, donors, etc.) is eligible to use the tool with certain conditions, which are listed below:
- Since the data is available in the public domain, we want it to be reliable and valid for reporting, comparison, and use. Therefore, we assume that the organization using the HPHC tool is a trustworthy and credible organization that will assure compliance with data collection procedures and protection of respondents’ privacy and confidentiality. It will also minimize the threat to the HPHC database.
- The requesting organization must be registered at the tool website to use the tool. This will also facilitate the requesting organization access to the raw data without respondents’ identification, if requested.
- The requesting organization should be willing to share the collected data in the public domain in aggregated form to keep the privacy and confidentiality of the respondents.
- The requesting organization must abide by the data collection guidance. The organization must specify whether it will use convenience (non-probability) or probability samples. Guidance is provided as to which method is preferable to answer a specific question (see Registration below). In addition, it will facilitate interpretation of the visualized data.
- The tool follows the axiom, “collect information to use it.” Therefore, the organization will be asked to specify how it will use the collected information.
If the requesting organization is willing to fulfill the criteria, then they should register for an account, as described below.
Registration Process
Step 1
Organizations meeting the eligibility requirements above should register for an account by completing this form.
Step 2
After receiving the registration form, CHISU will confirm the credibility of the requesting organization. CHISU will then enter the organization into the database and generate and send the requesting organization a unique link to the tool that represents an implementation of the tool: in other words, this link will represent a requesting organization conducting the HPHC tool in one country using one methodology (if a requesting organization plans to conduct more than one implementation of the tool, CHISU will generate additional links for it). Submissions to this unique link will be connected to the implementation in the database through the implementation identifier. In some countries, there might be more than one organization using the tool. The implementation identifier will distinguish various organizations using the HPHC tool in that country. This implementation identifier will assist CHISU in copying the data from the database for sharing with the requesting organization.
Country aggregation: The country unique identifier will be used to aggregate data from different organizations in the same country if the sampling method is similar among the organizations. See Table 1.
Step 3
The requesting organization will share the tool link with prospective respondents for accessing and filling the form. Note: We suggest that the requesting organization should articulate a detailed protocol on their selection process for the types of organizations and their staff who will be asked to fill out the tool. The requesting organization will also be asked to provide a start and end date for the survey or tool use and communicate that to CHISU. This survey time will also help in tracking change over time when the organization uses the tool repeatedly. In addition, the user organization should also decide when to send a reminder to the prospective respondents.
Step 4
Data will be visible as the tool is completed by participants.
HPHC Tool Use and Quality Checks
The HPHC tool is available in six languages – English, French, Spanish, Malagasy, Portuguese and Indonesian. However, the database is the same for the six languages.
Step 1
Read the informed consent and by filling it consent to be part of the survey.
Step 2
The shared tool link is automated with country and the organization's unique identifier. The respondent identifier is generated as they fill the tool.
The data quality is validated by three methods. First, the raw ratings are between 0 and 3. Second, the respondent is only allowed to enter a choice corresponding to the rating scale 0-3. Thus, no other entry is possible except 0,1,2,3, assuring data entry quality. Third, to avoid missing information (empty cells) which create problems in analysis, the respondent is only allowed to submit the form when all the required fields have been completed.
HPHC Database
The HPHC database has columns representing questions/variables and lines representing respondents such as in Table 1:
| Table 1: Database Organization | |||||
|---|---|---|---|---|---|
| Organization Unique Identifier (site generated) | Country unique ID (site generated) | Respondent number (site generated) | Country, Socio-demographic Q1-7 | Tool questions Q8-127 | Other questions Q128- |
| 1 | COUNTRY1 | 1 | |||
| 1 | COUNTRY1 | 2 | |||
| 2 | COUNTRY1 | 3 | |||
| 2 | COUNTRY1 | 4 | |||
| 2 | COUNTRY1 | 5 | |||
| 3 | COUNTRY1 | 6 | |||
| 4 | COUNTRY1 | 7 | |||
All questions are linked to the database for automated data entry. This means that when a respondent enters the answer, the answer goes directly to the appropriate question space/position in the database.
As one can see in Table 1, unique IDs facilitate identifying respondents from a specific requesting organization. Thus, only that specific data will be extracted from the database and shared with the requesting organization.
HPHC Analysis and Visualization
Standard Analysis
The HPHC tool is comprised of four AAAR domains. Therefore, the standard analysis is about these four domains and their subdomains. The analysis displays an overall score.
Each AAAR domain is comprised of 5-7 subdomains. These subdomains are labeled with the first three letters of the domain and a number. For example, the first subdomain under Accountability is labeled as accountable_1 (see Appendix A) and the subsequent subdomains were labeled as accountable_2, accountable_3, accountable_4, accountable_5, and accountable_6. The same pattern of labeling is following for Accessible, Affordable, and Reliable.
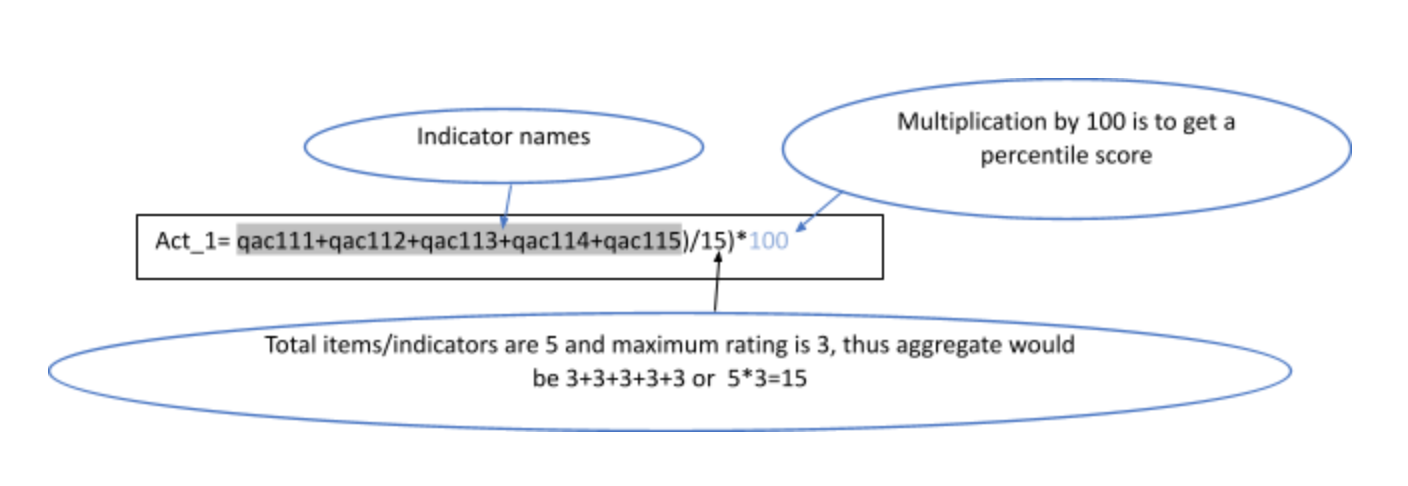
Calculation: Each subdomain is comprised of five indicators. Thus, all indicator ratings in a specific subdomain are aggregated and divided by maximum possible rating and multiplied by 100 to get a percentile score for that subdomain.
For example:
Please note that there are some indicators which are negatively worded. Therefore, for the calculation, their rating is reversed to arrive at the subdomain and overall domain score. For example:

Therefore, we need to reverse the rating before calculating subdomain percentile score as follows:
Affordable 1 = ((affordable_1__1 + affordable_1__2 + affordable_1__3 + (3 - affordable_1__4) + (3 - affordable_1__5)) / 15) * 100
Please see all formulas for calculating domain and subdomain percentile scores in Appendix A
Overall
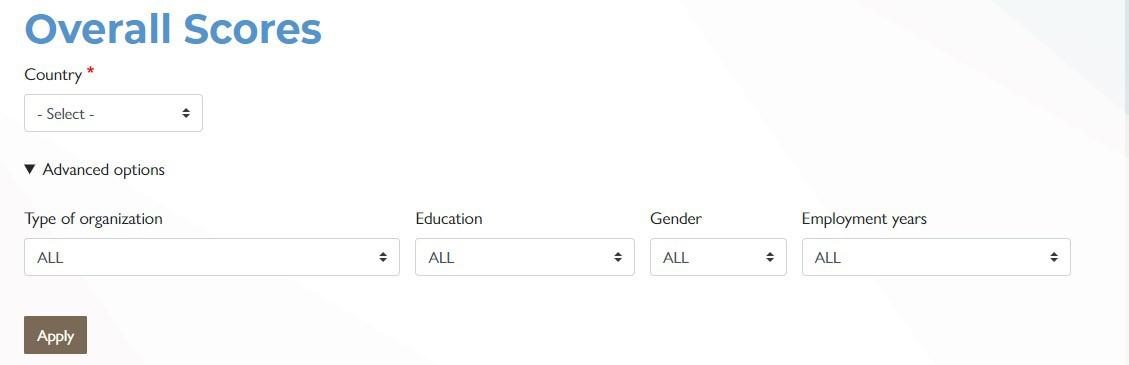
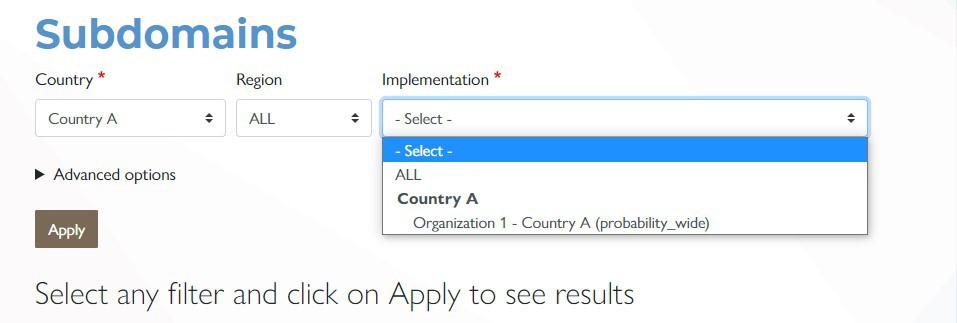
After selecting “country”, the form asks for selecting the Implementation which represents the Requesting Organization and methodology. There may be more than one organization in a country which may have used the tool. Therefore, it is possible to disaggregate data by the requesting organization. Thus, you can choose one organization or choose all organizations. Click apply to see the data visualized.
The first graphic shows the overall HPHC performance score and AAAR domain scores using a speedometer. The percentile scores range from zero to 100 and represent movement from lower to higher level. Thus, a higher score represents a higher level of performance.
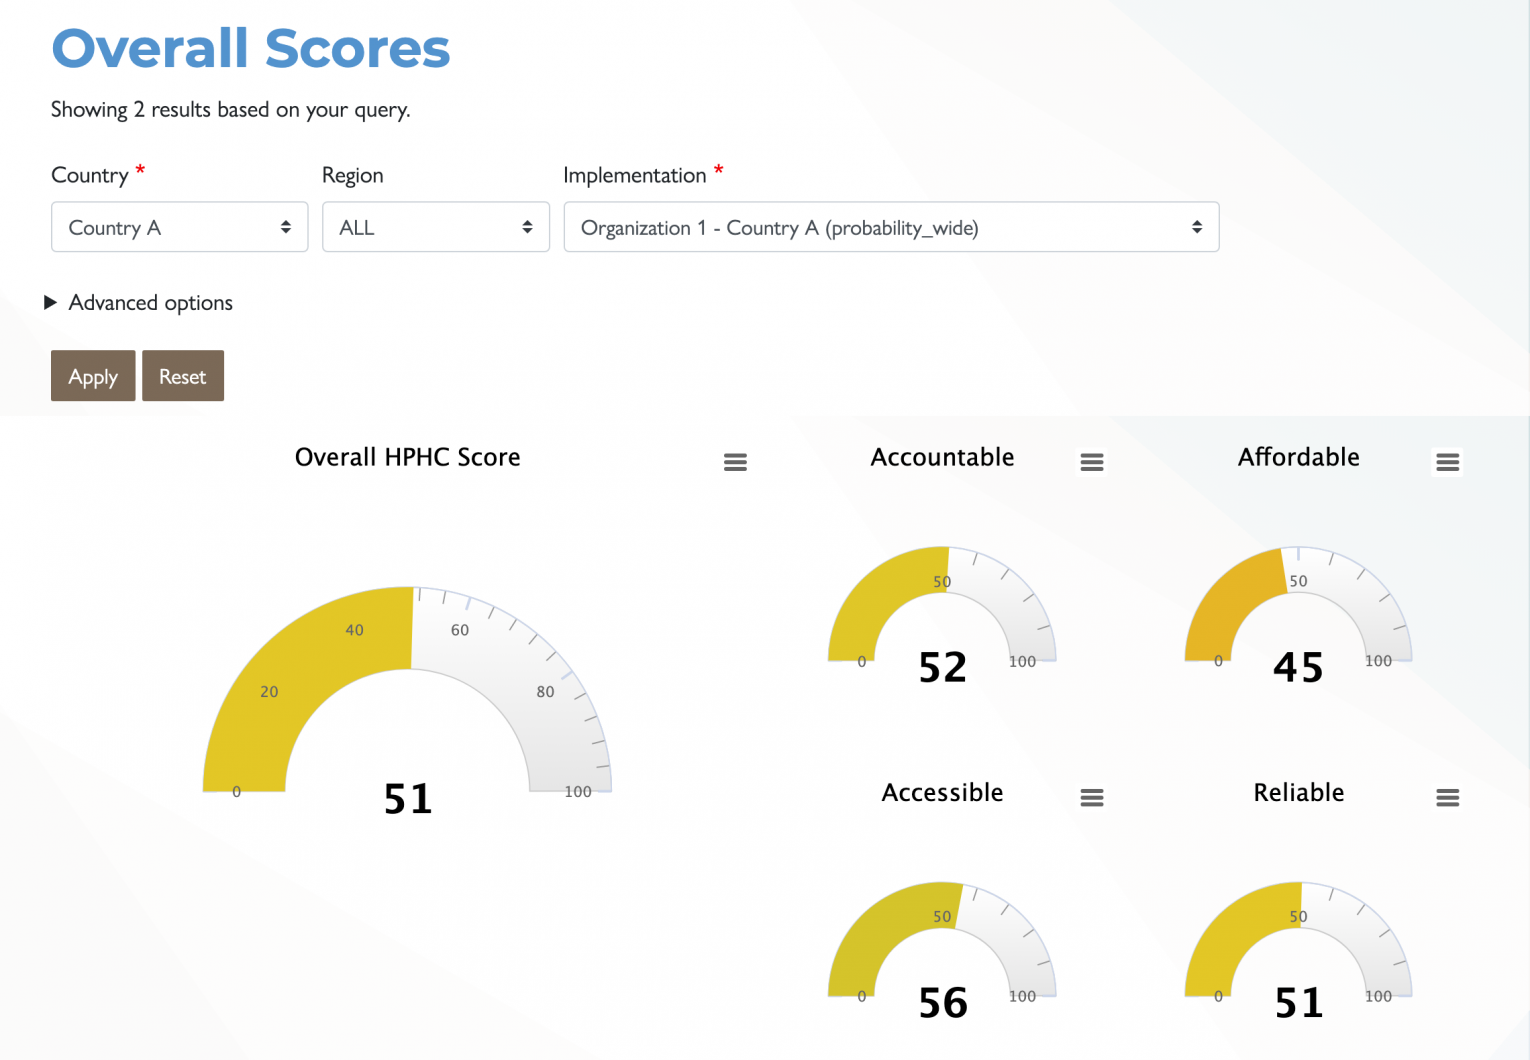
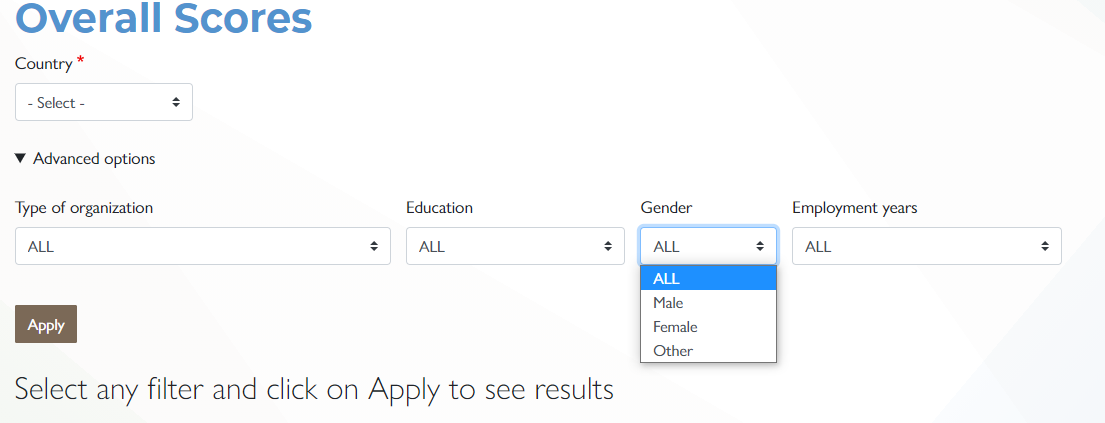
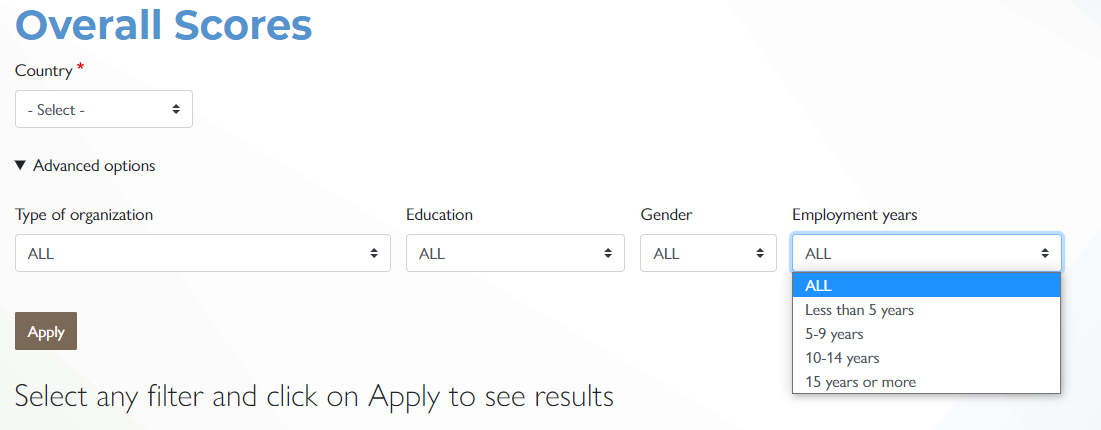
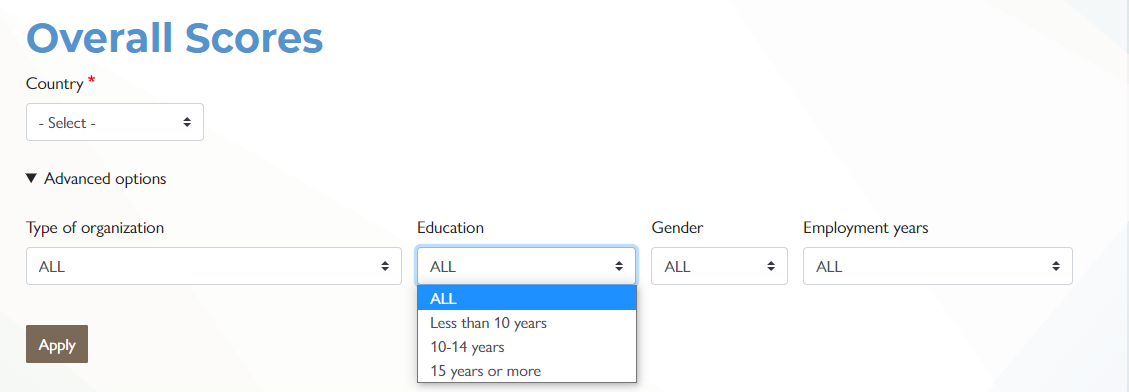
Under "Advanced options" there are four filters available to disaggregate the AAAR domain data; Type of organization, Education, Gender, and Employment years.

After selecting “Country”, the form asks for “Implementation”. There may be more than one organization in a country which may have used the tool. Therefore, it is possible to disaggregate data by the requesting organization. Choose one organization or choose all organizations.
Select the type of organization of the respondents. This will filter the HPHC score by type of organization. This category is very important and recommended for comparing responses from participants from different types of organizations - private, public, NGOs/CSOs/community leaders and international organizations. If the percentile scores disaggregated by types of organizations are close to each other or within 10 percent range one can safely conclude that the data is highly reliable and valid. This also means that people from different types of organizations have similar perceptions, that there is consensus. However, if there are major differences, then it shows that people from different groups of organizations differ in their responses and data need to be interpreted with caution.
Select the gender filter and observe whether the score changes by gender. Again, more similar scores provide higher confidence in data.
Select tab years of employment and education to compare whether the AAAR score varies.
Note that comparing data by respondents’ organization, education, gender provide a good idea of variations in AAAR score and thus give higher confidence in data if the variations are closer across all comparisons. If the variations are wide by one type of organization but not with other types of organizations, one may interpret data as the majority of respondents indicate. For example, if respondents from international organizations might have a low perception of accountability but the respondents from the public, private sector organizations and NGOs may differ then one may note that.
These advanced options for filtering are available on the Subdomains and Specialized Analyses screens as well.
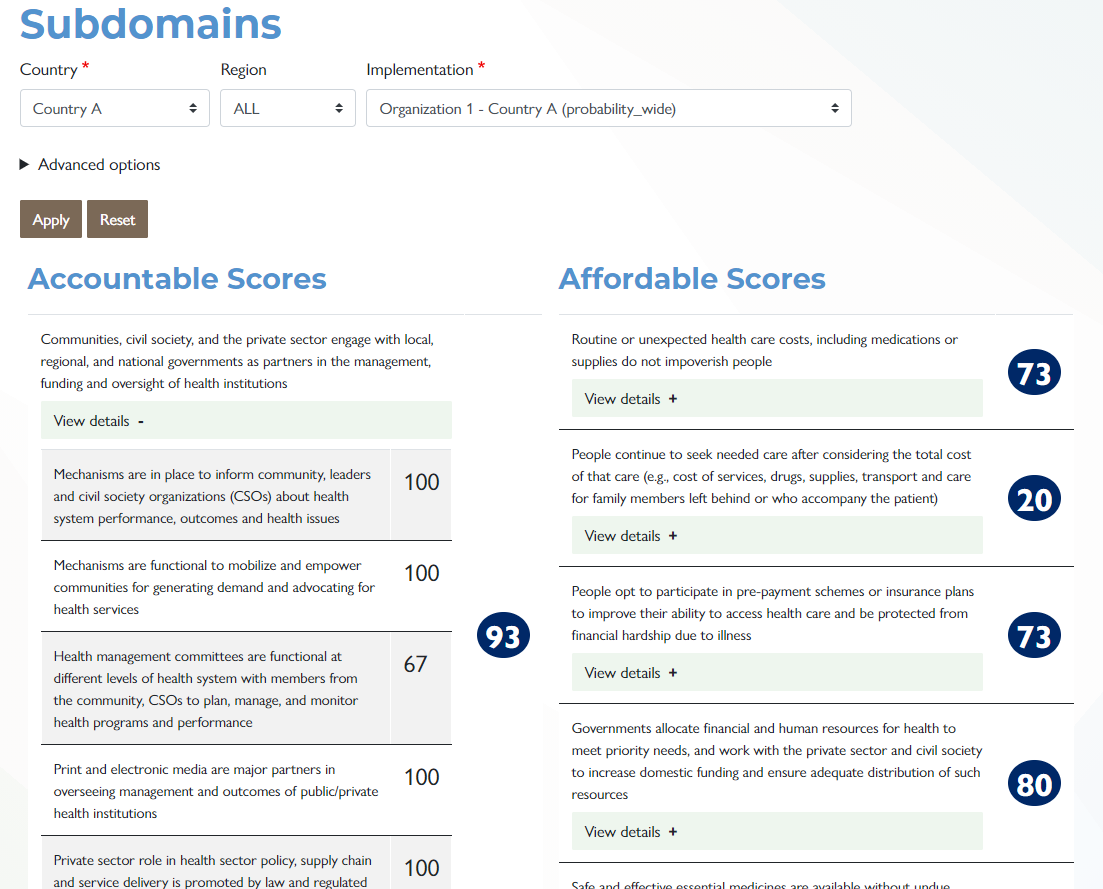
Subdomains
Click the Subdomain tab to see scores. This disaggregation of a specific AAAR domain provides how the domain overall score is calculated and understanding of the variations within subdomains. Again, this disaggregation identifies strengths and weaknesses and what to improve/change or maintain. These subdomains are part of the AAAR described under the HPHC fact sheet.
Click view details under each subdomain. This dropdown shows the indicator score under each subdomain. Again, the disaggregation of subdomain scores by indicators helps in identifying variations that exist within the subdomains indicators and which indicator needs action to improve its score.
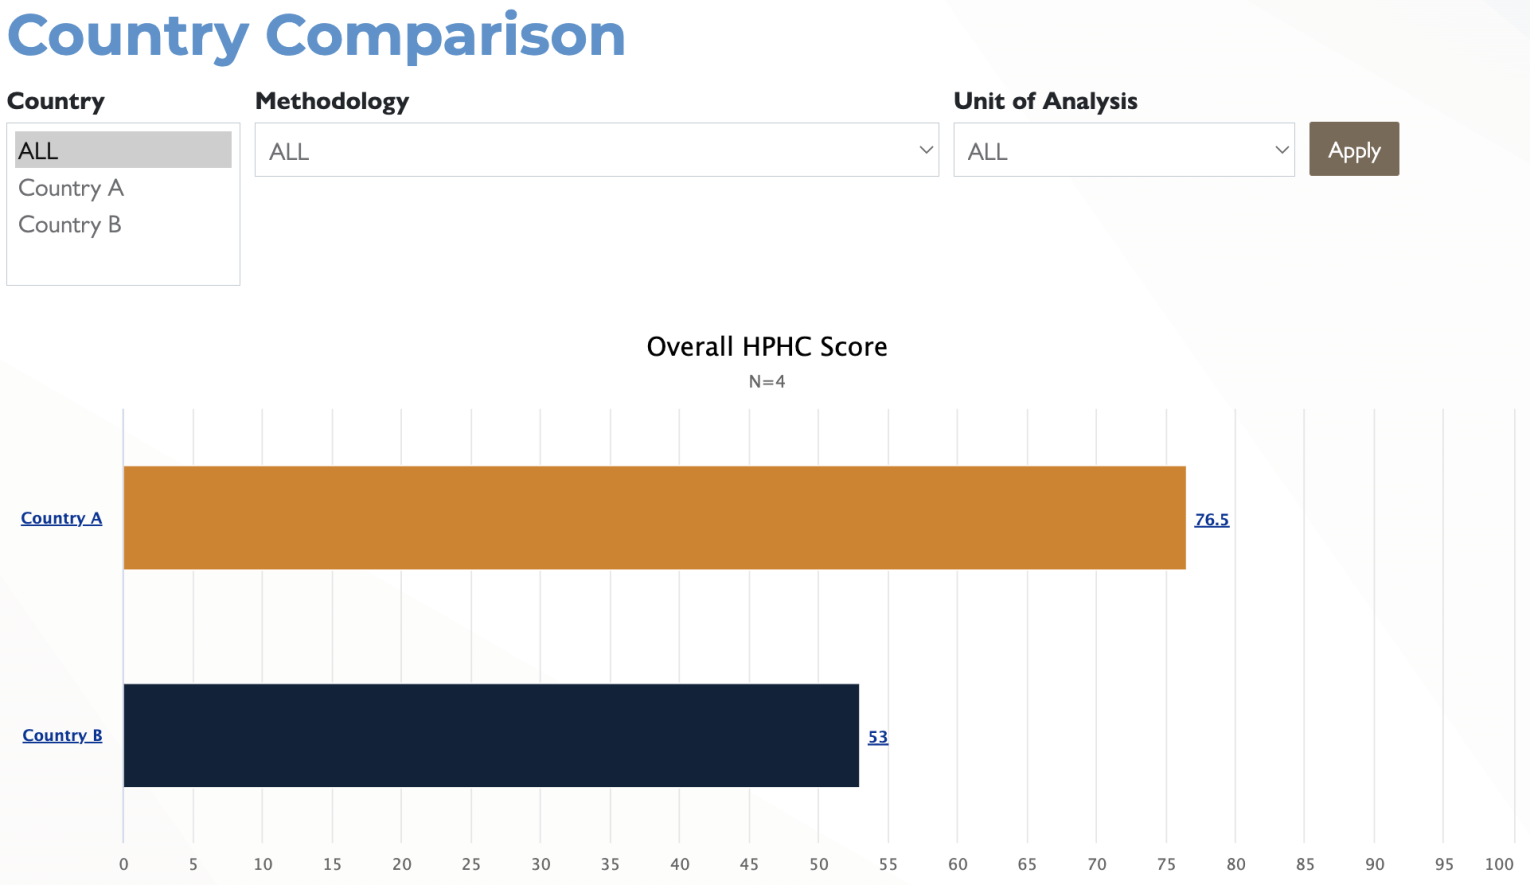
Country Comparison
To view a comparison of overall and AAAR scores by country, click on the Country Comparison tab. Select all countries or select individual countries for comparison by selecting them in the list and using the CTRL key.
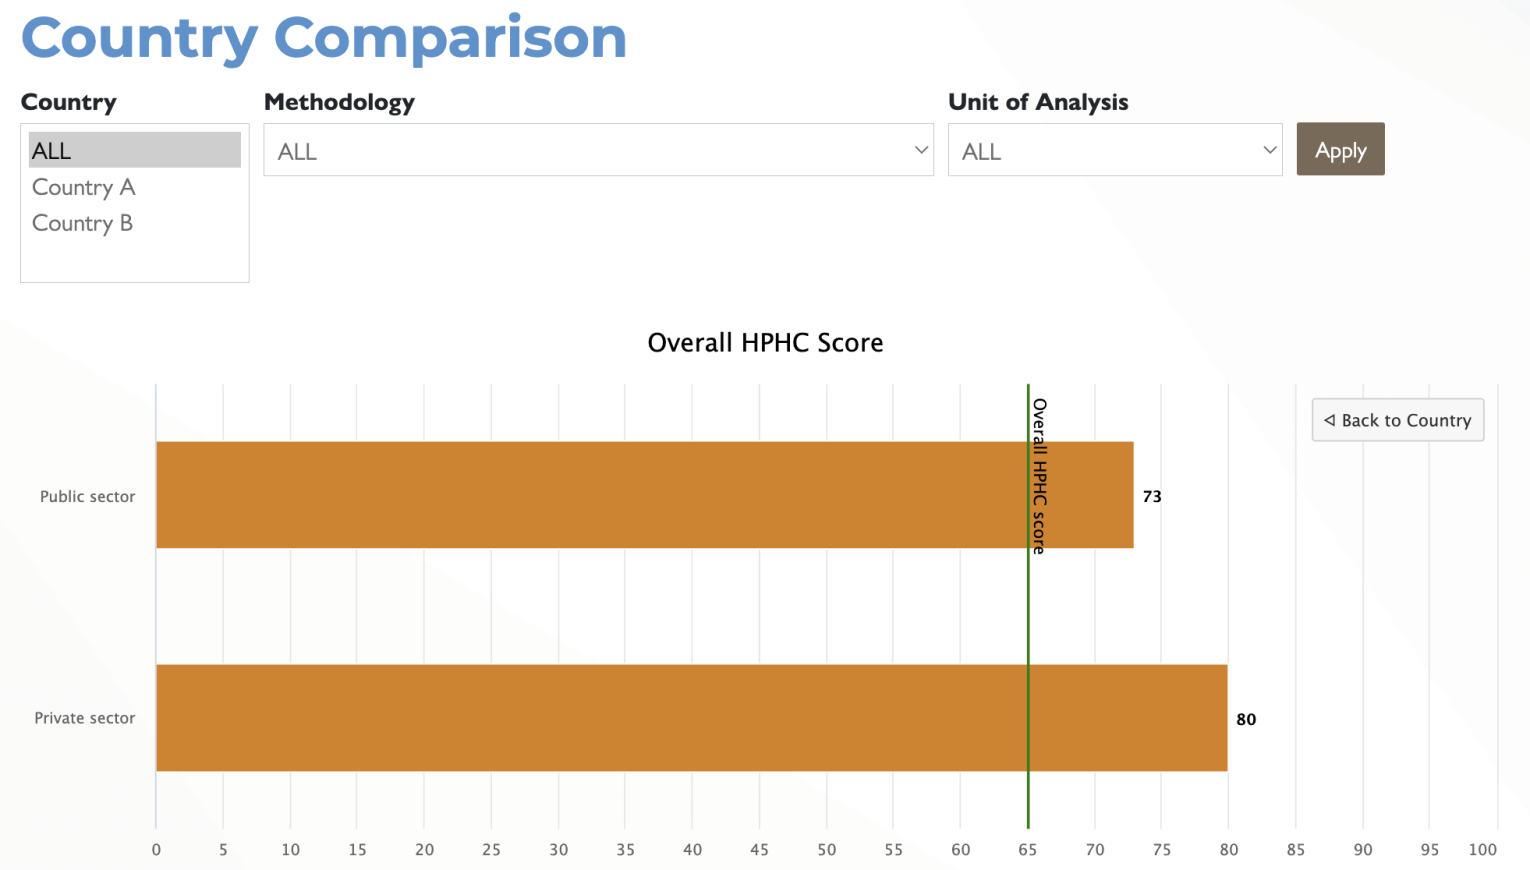
Clicking on any of the Country hyperlinks will then disaggregate that indicator based on the type of responding organization as can be seen in the screenshot below.
Specialized Analyses
AAAR domains could be further broken down into specialized analyses which focus on processes of topics of interest as well as using average score as benchmark to compare HPHC overall and AAAR domains score.
Functionality scores based on specific processes of topics of interest
Because the HPHC tool comprises multiple health system processes, dealing with different aspects of the health system, those functions and performance can be grouped into categories of interest, pulling from across the AAAR domains. These additional categories are quality, equity, resilience, responsiveness, health system functions, stakeholders (public and private sector, NGOs/CSOs, community) involvement, demand, and supply side, etc. These categories further help specify which aspects of the health system are working optimally and which ones need improvement.
Quality Processes
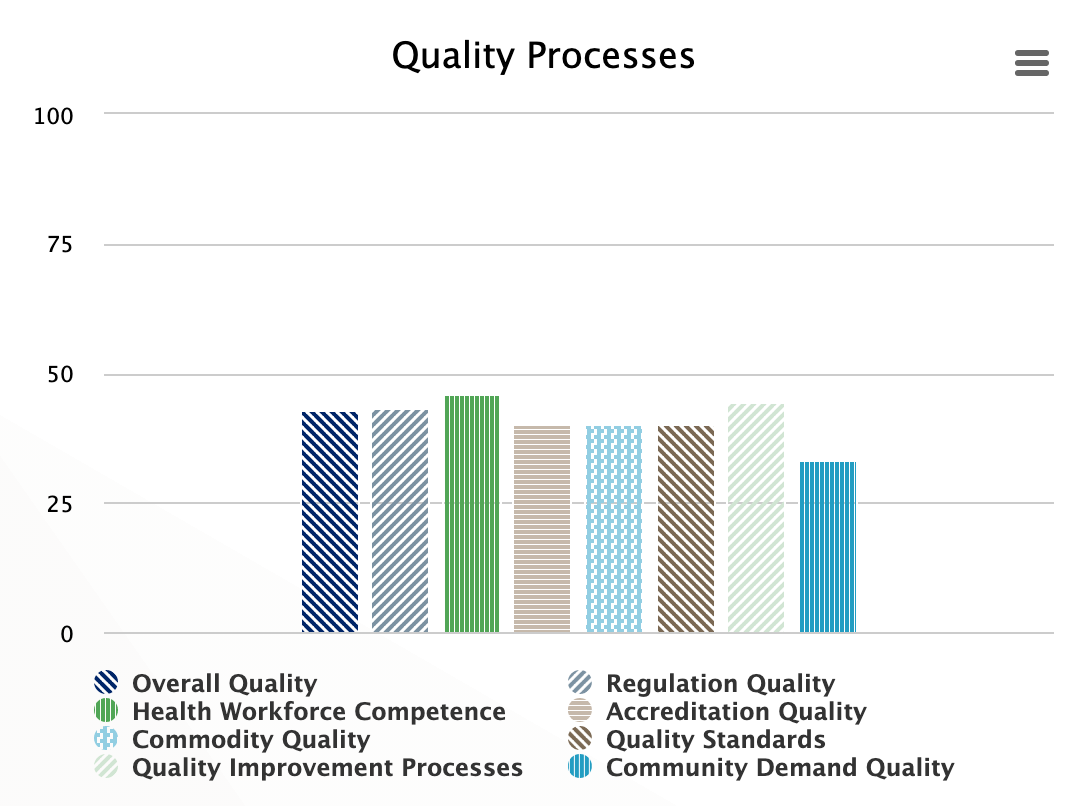
Quality is both a process and an outcome of care. For continuous improvement of quality, the system puts in place many processes including training of the health workforce to improve their competence, accreditation of the training institutions and facilities to meet required national standards, regulations to comply with quality, use of quality improvement methods, availability of standard of quality, and lastly that the community is educated to demand quality. These processes are grouped into the category of quality processes, which measure the level of functionality of these processes.
Equity Processes
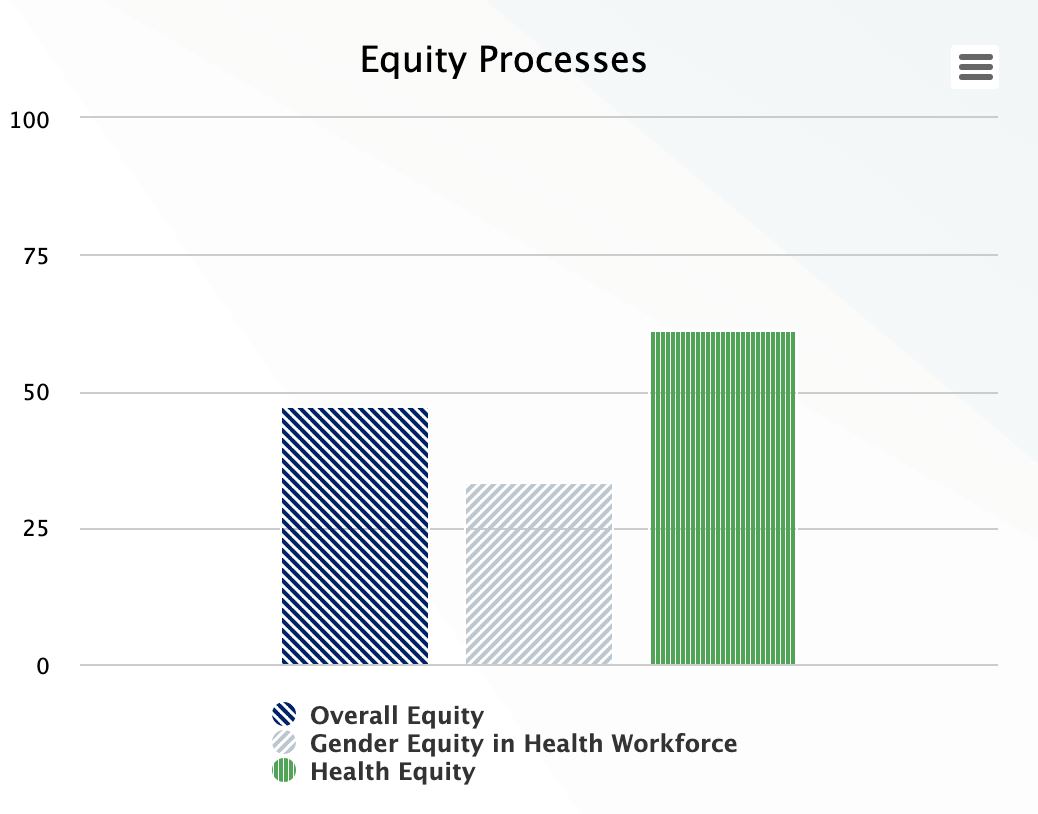
A high performing health system provides care irrespective of the individual’s gender, socioeconomic status, ethnicity, race, etc. and reduces health inequality among different social groups. HPHC has two sets of equity indicators – health and gender equity, which assesses the level of functionality of processes dealing with improving equity; Health equality includes items like whether the systems treat everyone equally, whether all groups are represented in facility management, and the extent to which the system tracks health disparities. Gender equity is measured by promotion of women’s autonomy, and the balance of female staff in the workforce.
Resilience Processes
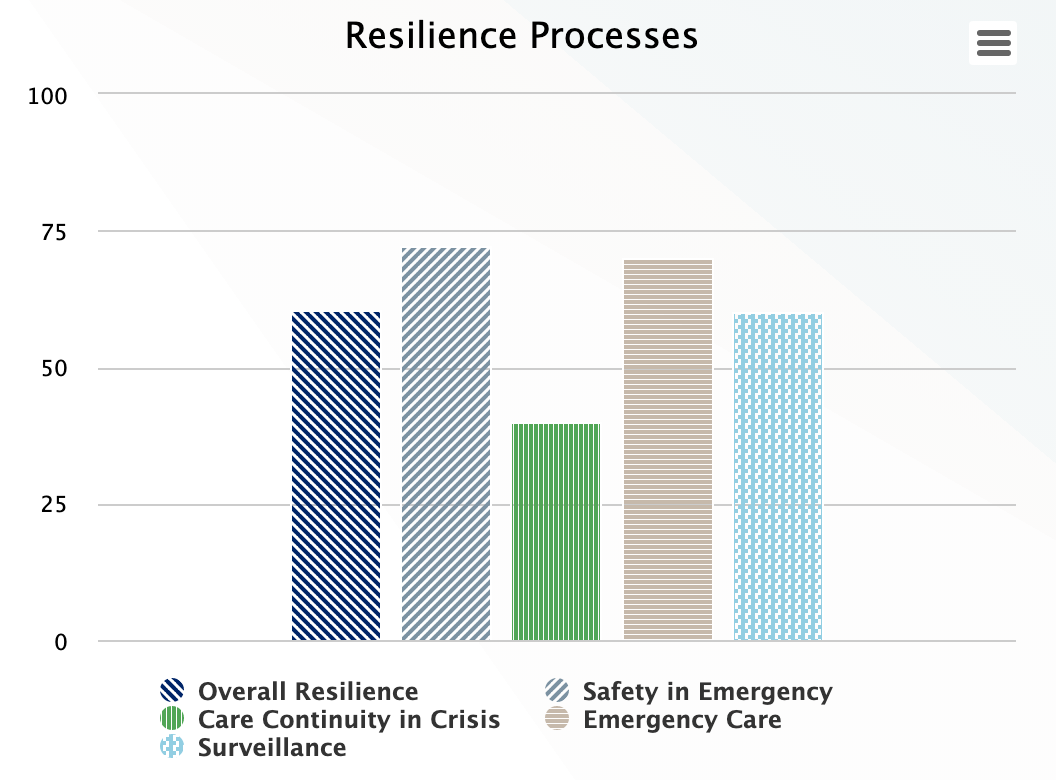
Health system resilience capacity is measured by processes that deal with surveillance of emerging problems, availability of emergency care, continuity of care in crises, and safety in emergencies. Although these indicators need to be seen in context with other supply and demand indicators, resilience emergence is the result of not only capacity but interactions with supply, demand, and contextual factors.
Responsiveness Processes
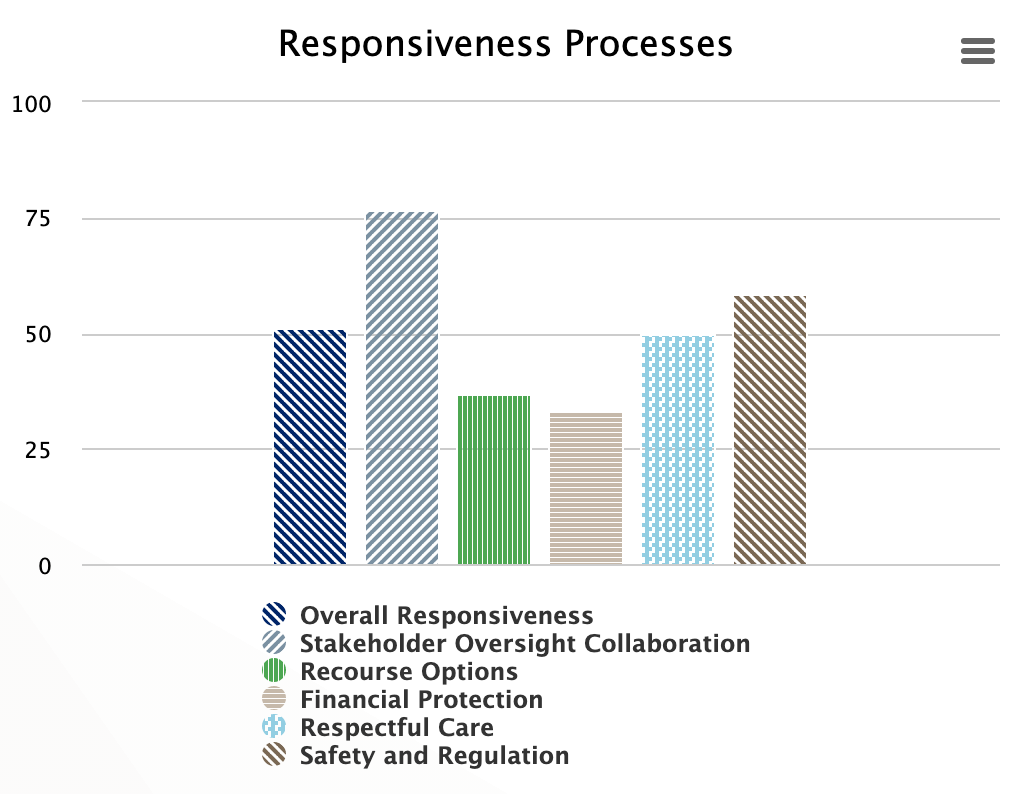
Responsiveness measures non-medical aspects of clients’ needs and whether they are met responsibly. The indicators included are respectful care, availability of recourse option if the clients have grievances, stakeholder collaboration on oversight, the existence of regulatory bodies that are trusted by health providers, and assurance of patient/provider safety from threats and harassment.
Clients' Trust Processes
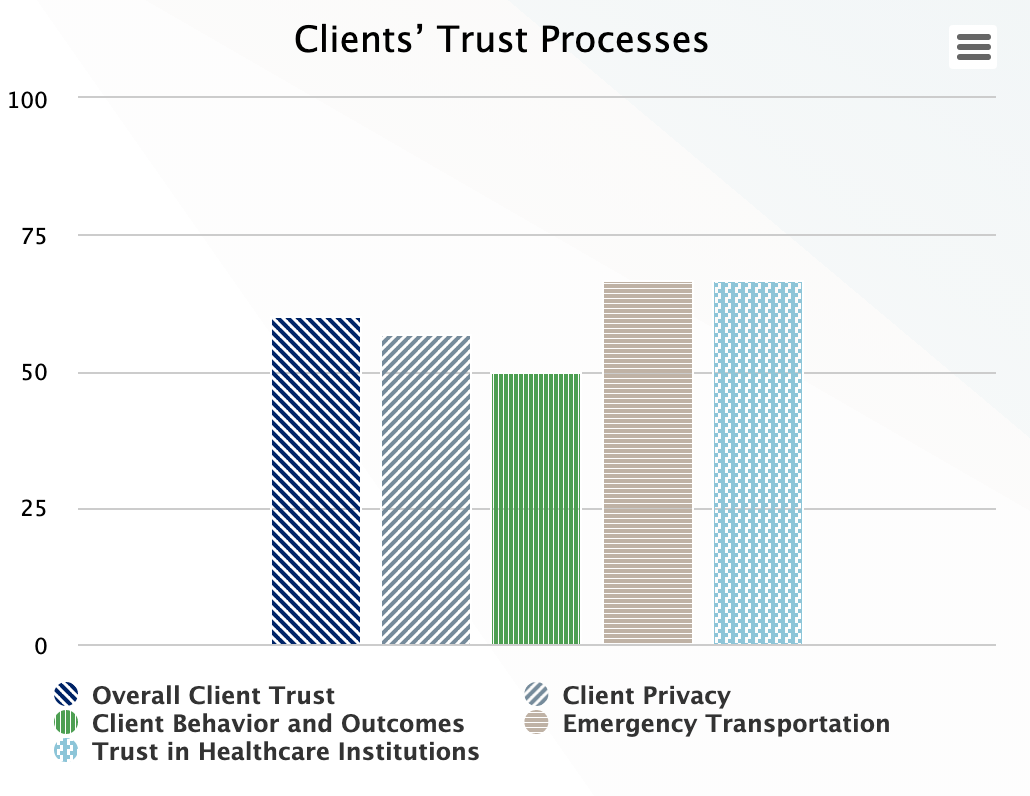
People need to trust the system, or they will not use its products and services and to give it legitimacy for developing policy and programs for addressing their health needs. Client trust is gauged by whether the system assures clients’ privacy, provides counseling on healthy behaviors and continuity of care and clients trust institutions to give the care they need including emergency transport.
Community Participation
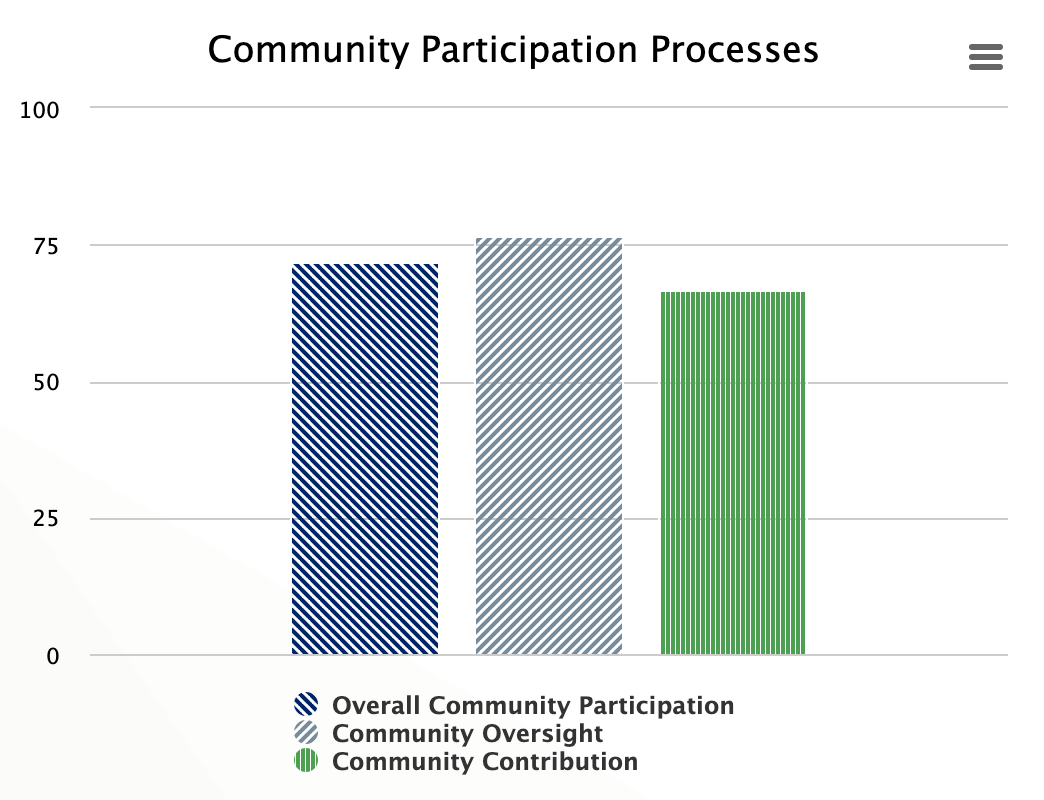
Community participation is critical to a high performing health system because without communities accepting and trusting the services, they will not utilize the services. Community participation is estimated by community involvement in demand for and oversight of the health system functions and outcomes as well community contributions in the form of mobilization for action, changing behaviors and being part of the facility management.
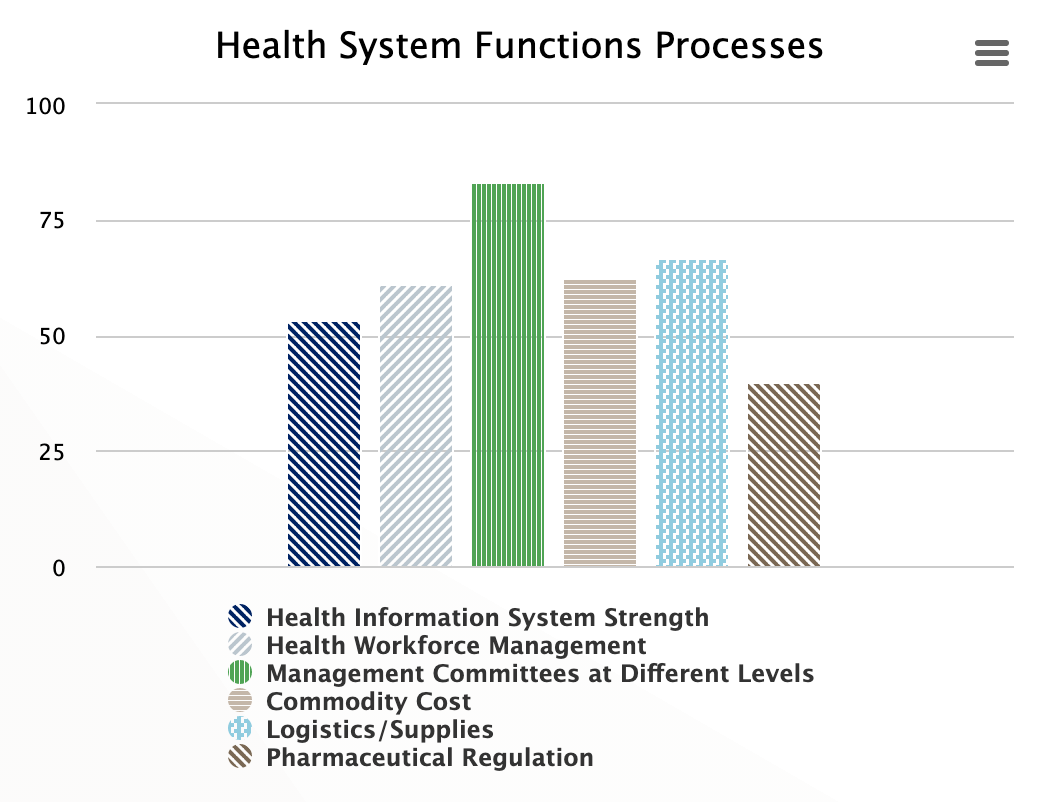
Health System Functions Processes
Health system strengthening is often described through the six health system functions and their interactions. The HPHC tool assesses different health system functions and creates opportunities to observe their interactions. It assesses whether information systems dealing with different functions and outcomes make the information available in public domain: if the health workforce is managed appropriately; if governance is measured by functionality of management committees with diverse representation at different levels of the system; and through pharmaceutical product regulation; are goods supplies processes considered under medical technologies; vaccine function; are commodity costs contained and are financial risk protection processes considered under financing functions. The score represents the level of functionality of health system functions overall and individually.
Demand Side Processes
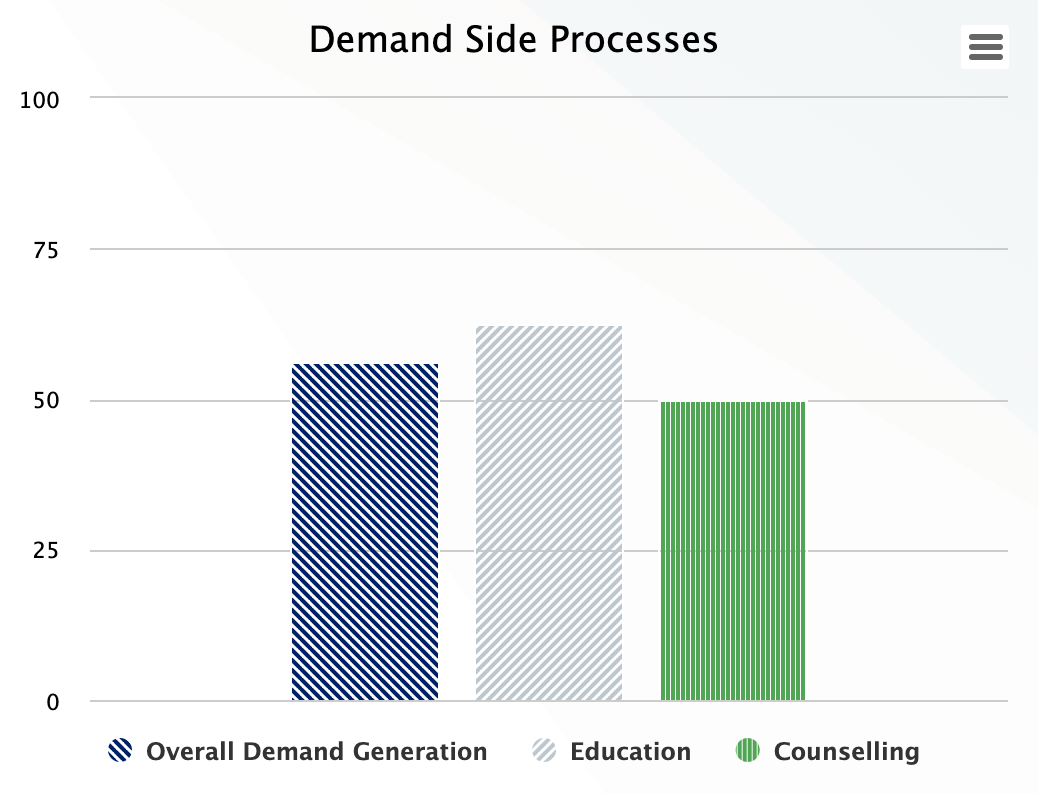
Demand generation for goods and services is critical for increasing health system utilization. However, it is not always made explicit. Two indicators, people’s education and clients counseling, are included to determine the level of demand in the health system. The scores reflect the level of process functionality for people’s education and client counseling for increasing people's knowledge about existing health services, how to deman care and utilize the health services.
Supply Side Processes
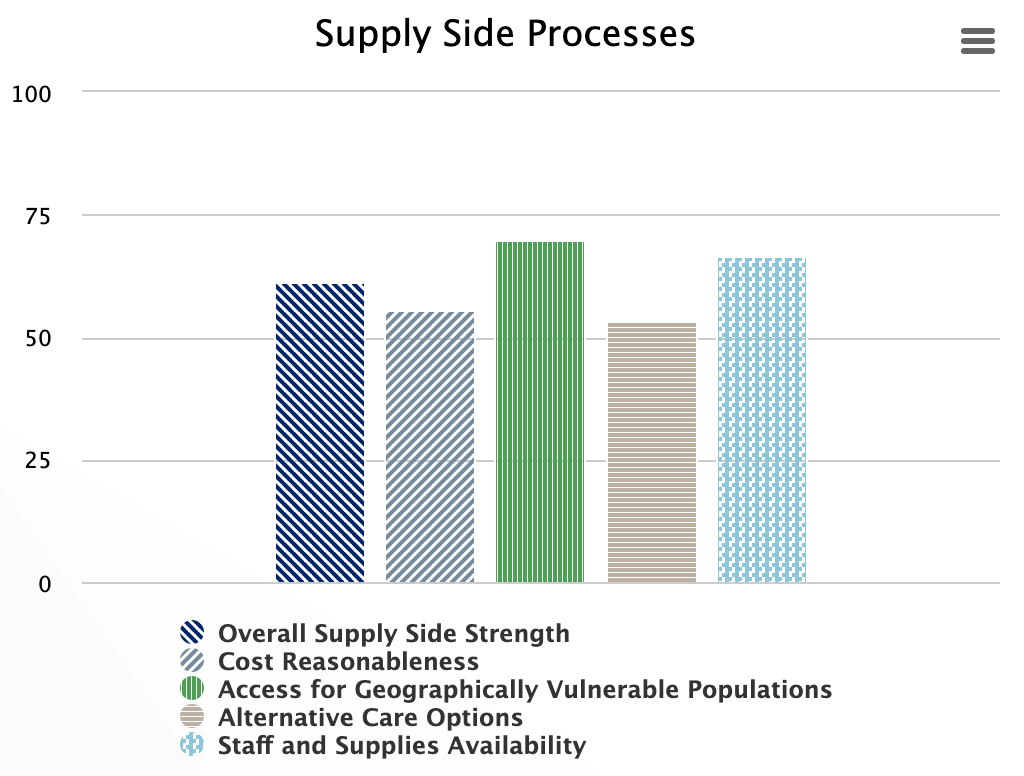
The health system creates necessary supply conditions to facilitate goods and services utilization. This means making costs reasonable for medicines, supplies, and treatment; and improving geographical and vulnerable access to services, providing alternate care options, and assuring availability of staff and supplies. The score represents the level of functionality of supply side processes.
Public Sector Involvement Processes
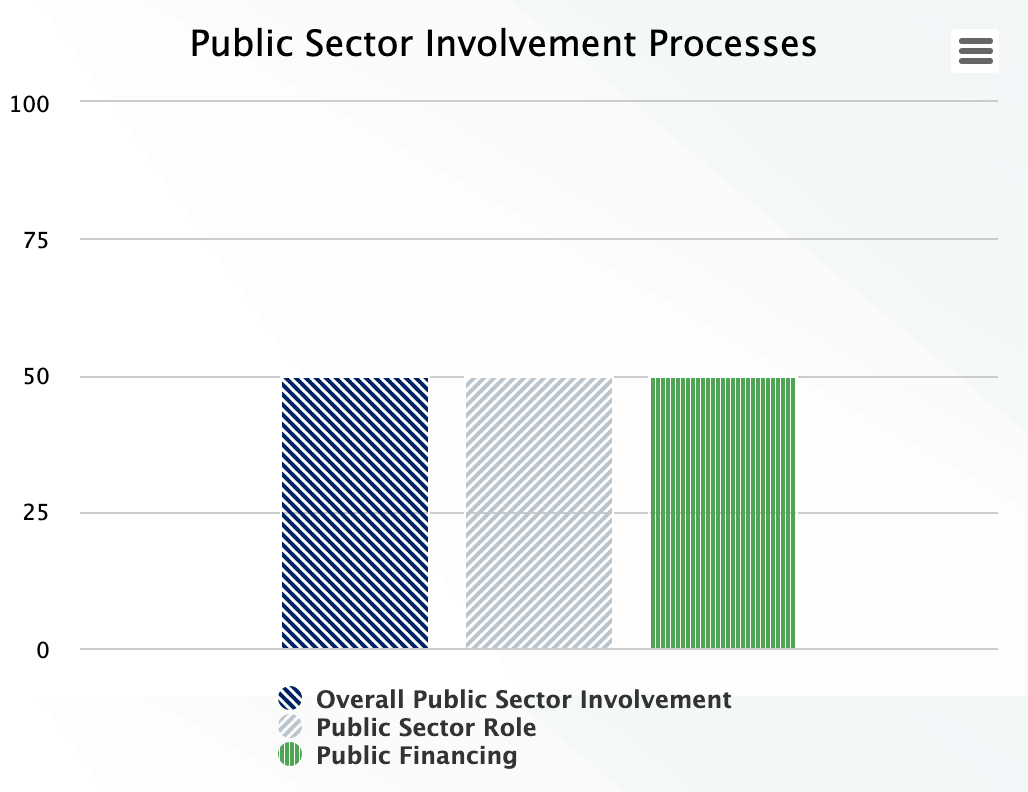
The public sector aspects of the health system lead in financing, managing goods and services and regulating the private sector especially in low-and-middle income countries. Thus, the public sector essentially governs and finances a big part of the system. However, under public sector involvement, indicators are specific to the public sector’s role in containing care costs and free services.
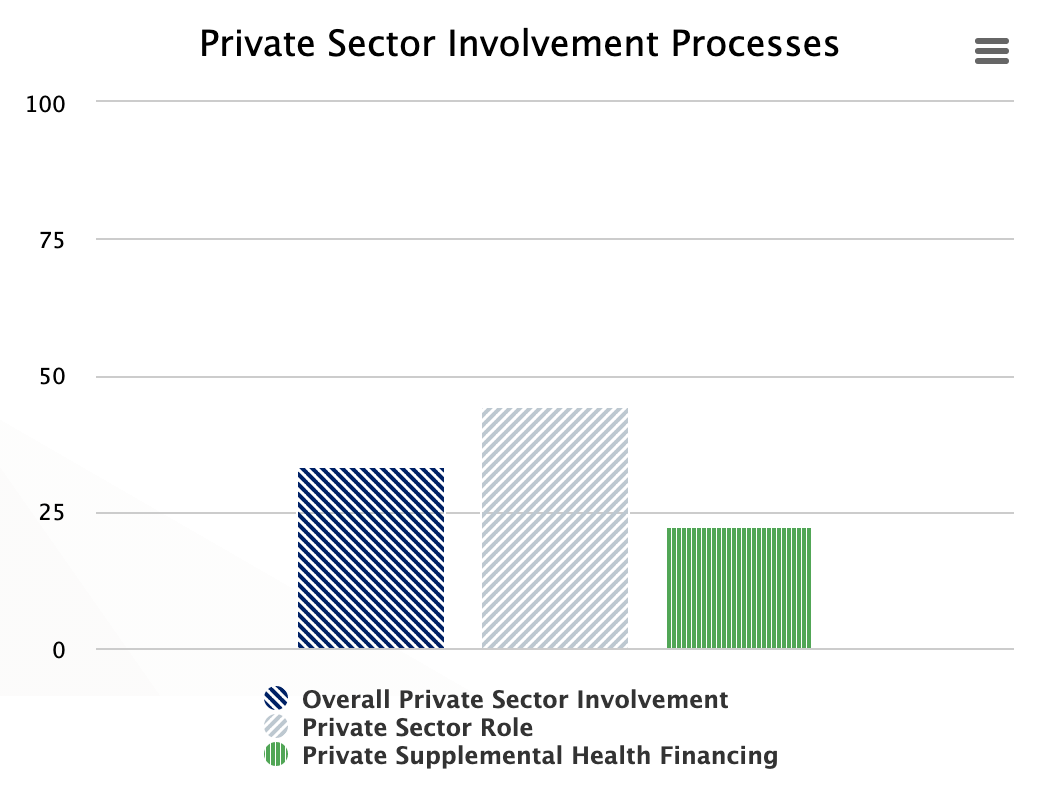
Private Sector Involvement Processes
The private sector plays an important role in policy development, production of medical supplies and delivering of medical goods and services. Therefore, it is important to understand their level of involvement and functionality. The role of the private sector is appraised by processes related to assuring its involvement and regulation by law, the costs of delivering services, availability of employers’ contribution and private insurance as well as private sector/donor supplement health financing.
Health Insurance and Multisector Collaboration Processes
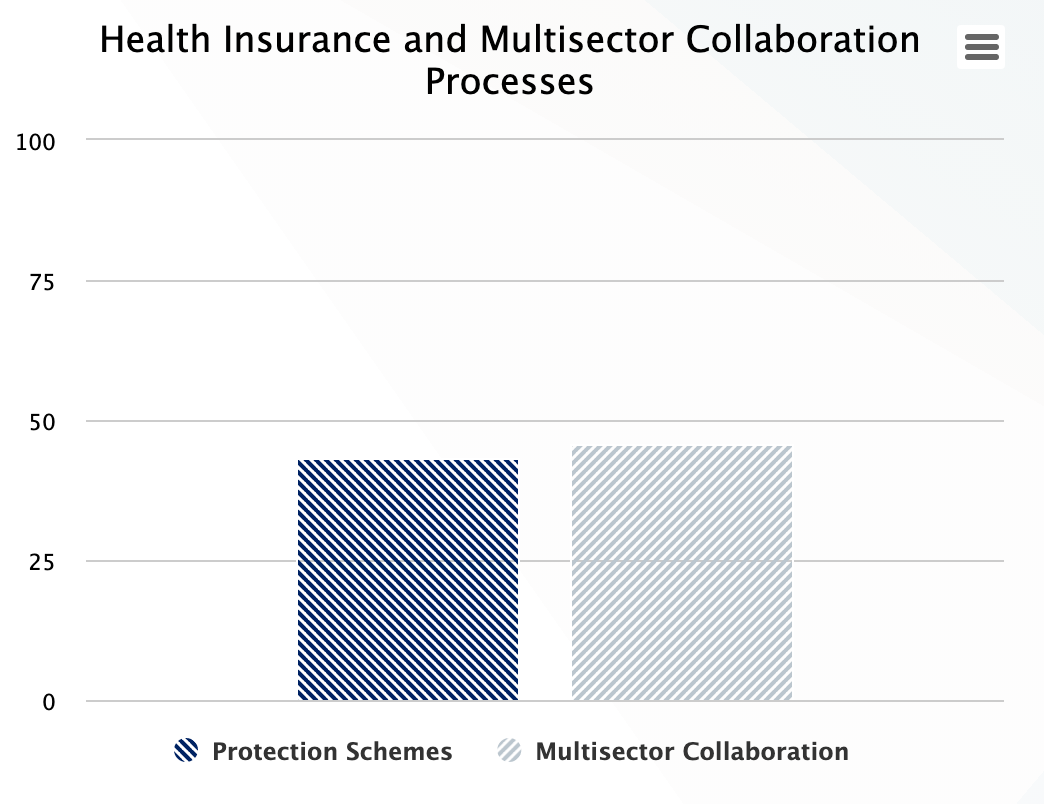
The health system is embedded in the broader socio-economic system and has a dynamic relationship of affecting it and being affected by it. The availability of infrastructure such as water and sanitation, electricity, road, communication networks, and interaction with law enforcement for safety affects the performance of the health system and emergence of health system resilience. Therefore, HPHC collects information on the collaboration of the health system with other sectors. The multi-sector collaboration processes and their level of functionality is reflected in the percentile score.
Comparison Over Time
The HPHC tool is also capable of providing comparisons over time across countries and by requesting organizations when they will use the tool repeatedly. Thus, the tool findings could be used for monitoring progress over time.
Contact CHISU/Office of Health Systems (OHS), USAID
The requesting organization using the tool could ask CHISU to provide a copy of the raw data with de-identification of the respondents to keep their privacy and responses confidential.
CHISU will provide technical assistance in the use of the tool or solving any problem encountered in use of the tool.
The data visualizations are made simple to understand and interpret. However, CHISU (steve_ollis@jsi.com) and OHS/USAID (aaqil@usaid.gov) could be contacted for any facilitation of the interpretation of the findings. In addition, if there is a need to further analyze HPHC data, please contact CHISU and OHS to assist.
Appendix A: Indicator Calculations
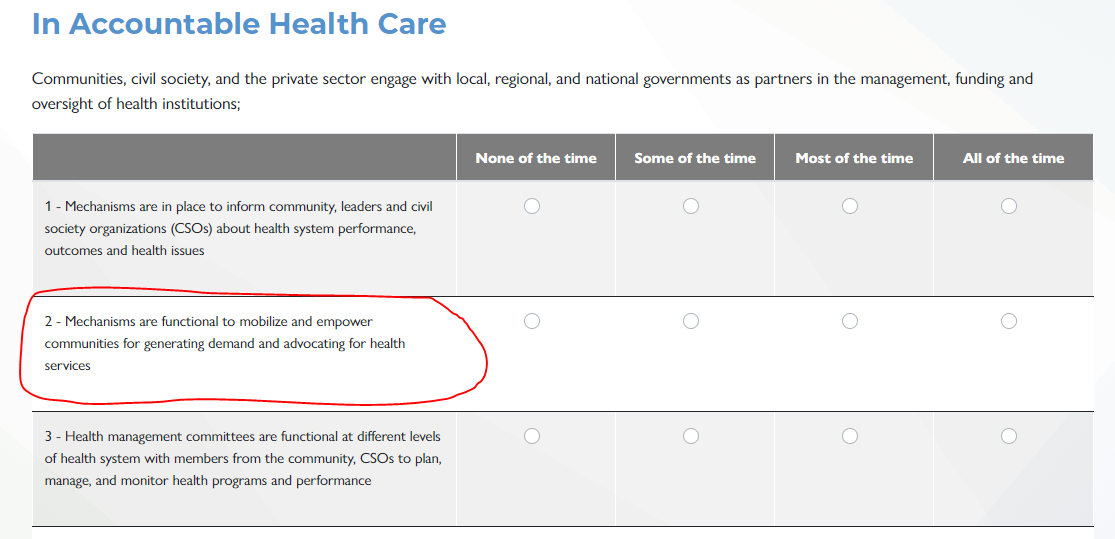
Note: the calculations below include variables named based on the AAAR (Accountable, Affordable, Accessible, Reliable) domains, the subdomain, and the question within that subdomain. For example, the question circled in the picture below would be @accountable_1__2 in the calculation because it's the second question in the first subdomain under Accountable Health Care.
Name | Calculation |
| Overall Scores | |
| Overall Score | ((((@accountable_1__1 + @accountable_1__2 + @accountable_1__3 + @accountable_1__4 + @accountable_1__5) / 15) * 100 +((@accountable_2__1 + @accountable_2__2 + @accountable_2__3 + @accountable_2__4 + (4-@accountable_2__5)) / 15) * 100 +(((3 - @accountable_3__1) + @accountable_3__2 + @accountable_3__3 + @accountable_3__4 + @accountable_3__5) / 15) * 100 +((@accountable_4__1 + @accountable_4__2 + @accountable_4__3 + (3 -@accountable_4__4) + @accountable_4__5) / 15) * 100 +((@accountable_5__1 + @accountable_5__2 + @accountable_5__3 + (3 -@accountable_5__4) + @accountable_5__5) / 15) * 100 +((@accountable_6__1 + @accountable_6__2 + @accountable_6__3 + (3 - @accountable_6__4) + @accountable_6__5) / 15) * 100) / 6 +(((@accessible_1__1 + @accessible_1__2 + @accessible_1__3 + @accessible_1__4 + @accessible_1__5) / 15) * 100 +((@accessible_2__1 + @accessible_2__2 + @accessible_2__3 + @accessible_2__4 + @accessible_2__5) / 15) * 100 +((@accessible_3__1 + @accessible_3__2 + @accessible_3__3 + @accessible_3__4 + @accessible_3__5) / 15) * 100 +((@accessible_4__1 + @accessible_4__2 + @accessible_4__3 + @accessible_4__4 + @accessible_4__5) / 15) * 100 +((@accessible_5__1 + @accessible_5__2 + @accessible_5__3 + @accessible_5__4 + @accessible_5__5) / 15) * 100 +((@accessible_6__1 + @accessible_6__2 + @accessible_6__3 + @accessible_6__4 + @accessible_6__5) / 15) * 100) / 6 +(((@affordable_1__1 + @affordable_1__2 + @affordable_1__3 + (3 - @affordable_1__4) + (3 - @affordable_1__5)) / 15) * 100 +(((3 - @affordable_2__1) + (3 - @affordable_2__2) + (3 - @affordable_2__3) + (3 - @affordable_2__4) + (3 - @affordable_2__5)) / 15) * 100 +((@affordable_3__1 + @affordable_3__2 + @affordable_3__3 + @affordable_3__4 + @affordable_3__5) / 15) * 100 +((@affordable_4__1 + @affordable_4__2 + @affordable_4__3 + @affordable_4__4 + @affordable_4__5) / 15) * 100 +((@affordable_5__1 + @affordable_5__2 + (3 - @affordable_5__3) + @affordable_5__4 + @affordable_5__5) / 15) * 100) / 5 +(((@reliable_1__1 + @reliable_1__2 + @reliable_1__3 + (3 - @reliable_1__4) + @reliable_1__5) / 15) * 100 +((@reliable_2__1 + @reliable_2__2 + @reliable_2__3 + @reliable_2__4 + @reliable_2__5) / 15) * 100 +((@reliable_3__1 + @reliable_3__2 + @reliable_3__3 + @reliable_3__4 + @reliable_3__5) / 15) * 100 +((@reliable_4__1 + @reliable_4__2 + @reliable_4__3 + @reliable_4__4 + @reliable_4__5) / 15) * 100 +((@reliable_5__1 + @reliable_5__2 + @reliable_5__3 + @reliable_5__4 + @reliable_5__5) / 15) * 100 +((@reliable_6__1 + @reliable_6__2 + @reliable_6__3 + @reliable_6__4 + @reliable_6__5) / 15) * 100 +((@reliable_7__1 + @reliable_7__2 + @reliable_7__3 + @reliable_7__4 + @reliable_7__5) / 15) * 100) / 7) / 4 |
| Accountable Score | (((@accountable_1__1 + @accountable_1__2 + @accountable_1__3 + @accountable_1__4 + @accountable_1__5) / 15) * 100 + ((@accountable_2__1 + @accountable_2__2 + @accountable_2__3 + @accountable_2__4 + (3 -@accountable_2__5)) / 15) * 100 +(((3 - @accountable_3__1) + @accountable_3__2 + @accountable_3__3 + @accountable_3__4 + @accountable_3__5) / 15) * 100 +((@accountable_4__1 + @accountable_4__2 + @accountable_4__3 + (3 -@accountable_4__4) + @accountable_4__5) / 15) * 100 +((@accountable_5__1 + @accountable_5__2 + @accountable_5__3 + (3 -@accountable_5__4) + @accountable_5__5) / 15) * 100 + ((@accountable_6__1 + @accountable_6__2 + @accountable_6__3 + (3 - @accountable_6__4) + @accountable_6__5) / 15) * 100) / 6 |
| Affordable Score | (((@affordable_1__1 + @affordable_1__2 + @affordable_1__3 + (3 - @affordable_1__4) + (3 - @affordable_1__5)) / 15) * 100 + (((3 - @affordable_2__1) + (3 - @affordable_2__2) + (3 - @affordable_2__3) + (3 - @affordable_2__4) + (3 - @affordable_2__5)) / 15) * 100 +((@affordable_3__1 + @affordable_3__2 + @affordable_3__3 + @affordable_3__4 + @affordable_3__5) / 15) * 100 +((@affordable_4__1 + @affordable_4__2 + @affordable_4__3 + @affordable_4__4 + @affordable_4__5) / 15) * 100 +((@affordable_5__1 + @affordable_5__2 + (3 - @affordable_5__3) + @affordable_5__4 + @affordable_5__5) / 15) * 100) / 5 |
| Accessible Score | (((@accessible_1__1 + @accessible_1__2 + @accessible_1__3 + @accessible_1__4 + @accessible_1__5) / 15) * 100 +((@accessible_2__1 + @accessible_2__2 + @accessible_2__3 + @accessible_2__4 + @accessible_2__5) / 15) * 100 +((@accessible_3__1 + @accessible_3__2 + @accessible_3__3 + @accessible_3__4 + @accessible_3__5) / 15) * 100 +((@accessible_4__1 + @accessible_4__2 + @accessible_4__3 + @accessible_4__4 + @accessible_4__5) / 15) * 100 +((@accessible_5__1 + @accessible_5__2 + @accessible_5__3 + @accessible_5__4 + @accessible_5__5) / 15) * 100 +((@accessible_6__1 + @accessible_6__2 + @accessible_6__3 + @accessible_6__4 + @accessible_6__5) / 15) * 100) / 6 |
| Reliable Score | (((@reliable_1__1 + @reliable_1__2 + @reliable_1__3 + (3 - @reliable_1__4) + @reliable_1__5) / 15) * 100 +((@reliable_2__1 + @reliable_2__2 + @reliable_2__3 + @reliable_2__4 + @reliable_2__5) / 15) * 100 +((@reliable_3__1 + @reliable_3__2 + @reliable_3__3 + @reliable_3__4 + @reliable_3__5) / 15) * 100 +((@reliable_4__1 + @reliable_4__2 + @reliable_4__3 + @reliable_4__4 + @reliable_4__5) / 15) * 100 +((@reliable_5__1 + @reliable_5__2 + @reliable_5__3 + @reliable_5__4 + @reliable_5__5) / 15) * 100 +((@reliable_6__1 + @reliable_6__2 + @reliable_6__3 + @reliable_6__4 + @reliable_6__5) / 15) * 100 +((@reliable_7__1 + @reliable_7__2 + @reliable_7__3 + @reliable_7__4 + @reliable_7__5) / 15) * 100) / 7 |
| Subdomain Scores | |
| Accountable 1 | ((@accountable_1__1 + @accountable_1__2 + @accountable_1__3 + @accountable_1__4 + @accountable_1__5) / 15) * 100 |
| Accountable 1.1 | @accountable_1__1 / 3 * 100 |
| Accountable 1.2 | @accountable_1__2 / 3 * 100 |
| Accountable 1.3 | @accountable_1__3 / 3 * 100 |
| Accountable 1.4 | @accountable_1__4 / 3 * 100 |
| Accountable 1.5 | @accountable_1__5 / 3 * 100 |
| Accountable 2 | ((@accountable_2__1 + @accountable_2__2 + @accountable_2__3 + @accountable_2__4 + (3 -@accountable_2__5)) / 15) * 100 |
| Accountable 2.1 | @accountable_2__1 / 3 * 100 |
| Accountable 2.2 | @accountable_2__2 / 3 * 100 |
| Accountable 2.3 | @accountable_2__3 / 3 * 100 |
| Accountable 2.4 | @accountable_2__4 / 3 * 100 |
| Accountable 2.5 | (3 - @accountable_2__5) / 3 * 100 |
| Accountable 3 | (((3 - @accountable_3__1) + @accountable_3__2 + @accountable_3__3 + @accountable_3__4 + @accountable_3__5) / 15) * 100 |
| Accountable 3.1 | (3 - @accountable_3__1) / 3 * 100 |
| Accountable 3.2 | @accountable_3__2 / 3 * 100 |
| Accountable 3.3 | @accountable_3__3 / 3 * 100 |
| Accountable 3.4 | @accountable_3__4 / 3 * 100 |
| Accountable 3.5 | @accountable_3__5 / 3 * 100 |
| Accountable 4 | ((@accountable_4__1 + @accountable_4__2 + @accountable_4__3 + (3 -@accountable_4__4) + @accountable_4__5) / 15) * 100 |
| Accountable 4.1 | @accountable_4__1 / 3 * 100 |
| Accountable 4.2 | @accountable_4__2 / 3 * 100 |
| Accountable 4.3 | @accountable_4__3 / 3 * 100 |
| Accountable 4.4 | (3 - @accountable_4__4) / 3 * 100 |
| Accountable 4.5 | @accountable_4__5 / 3 * 100 |
| Accountable 5 | ((@accountable_5__1 + @accountable_5__2 + @accountable_5__3 + (3 -@accountable_5__4) + @accountable_5__5) / 15) * 100 |
| Accountable 5.1 | @accountable_5__1 / 3 * 100 |
| Accountable 5.2 | @accountable_5__2 / 3 * 100 |
| Accountable 5.3 | @accountable_5__3 / 3 * 100 |
| Accountable 5.4 | (3 - @accountable_5__4) / 3 * 100 |
| Accountable 5.5 | @accountable_5__5 / 3 * 100 |
| Accountable 6 | ((@accountable_6__1 + @accountable_6__2 + @accountable_6__3 + (3 - @accountable_6__4) + @accountable_6__5) / 15) * 100 |
| Accountable 6.1 | @accountable_6__1 / 3 * 100 |
| Accountable 6.2 | @accountable_6__2 / 3 * 100 |
| Accountable 6.3 | @accountable_6__3 / 3 * 100 |
| Accountable 6.4 | (3 - @accountable_6__4) / 3 * 100 |
| Accountable 6.5 | @accountable_6__5 / 3 * 100 |
| Affordable 1 | ((@affordable_1__1 + @affordable_1__2 + @affordable_1__3 + (3 - @affordable_1__4) + (3 - @affordable_1__5)) / 15) * 1000 |
| Affordable 1.1 | @affordable_1__1 / 3 * 100 |
| Affordable 1.2 | @affordable_1__2 / 3 * 100 |
| Affordable 1.3 | @affordable_1__3 / 3 * 100 |
| Affordable 1.4 | (3 - @affordable_1__4) / 3 * 100 |
| Affordable 1.5 | (3 - @affordable_1__5) / 3 * 100 |
| Affordable 2 | (((3 - @affordable_2__1) + (3 - @affordable_2__2) + (3 - @affordable_2__3) + (3 - @affordable_2__4) + (3 - @affordable_2__5)) / 15) * 100 |
| Affordable 2.1 | (3 - @affordable_2__1) / 3 * 100 |
| Affordable 2.2 | (3 - @affordable_2__2) / 3 * 100 |
| Affordable 2.3 | (3 - @affordable_2__3) / 3 * 100 |
| Affordable 2.4 | (3 - @affordable_2__4) / 3 * 100 |
| Affordable 2.5 | (3 - @affordable_2__5) / 3 * 100 |
| Affordable 3 | ((@affordable_3__1 + @affordable_3__2 + @affordable_3__3 + @affordable_3__4 + @affordable_3__5) / 15) * 100 |
| Affordable 3.1 | @affordable_3__1 / 3 * 100 |
| Affordable 3.2 | @affordable_3__2 / 3 * 100 |
| Affordable 3.3 | @affordable_3__3 / 3 * 100 |
| Affordable 3.4 | @affordable_3__4 / 3 * 100 |
| Affordable 3.5 | @affordable_3__5 / 3 * 100 |
| Affordable 4 | ((@affordable_4__1 + @affordable_4__2 + @affordable_4__3 + @affordable_4__4 + @affordable_4__5) / 15) * 100 |
| Affordable 4.1 | @affordable_4__1 / 3 * 100 |
| Affordable 4.2 | @affordable_4__2 / 3 * 100 |
| Affordable 4.3 | @affordable_4__3 / 3 * 100 |
| Affordable 4.4 | @affordable_4__4 / 3 * 100 |
| Affordable 4.5 | @affordable_4__5 / 3 * 100 |
| Affordable 5 | ((@affordable_5__1 + @affordable_5__2 + (3 - @affordable_5__3) + @affordable_5__4 + @affordable_5__5) / 15) * 100 |
| Affordable 5.1 | @affordable_5__1 / 3 * 100 |
| Affordable 5.2 | @affordable_5__2 / 3 * 100 |
| Affordable 5.3 | (3 - @affordable_5__3) / 3 * 100 |
| Affordable 5.4 | @affordable_5__4 / 3 * 100 |
| Affordable 5.5 | @affordable_5__5 / 3 * 100 |
| Accessible 1 | ((@accessible_1__1 + @accessible_1__2 + @accessible_1__3 + @accessible_1__4 + @accessible_1__5) / 15) * 100 |
| Accessible 1.1 | @accessible_1__1 / 3 * 100 |
| Accessible 1.2 | @accessible_1__2 / 3 * 100 |
| Accessible 1.3 | @accessible_1__3 / 3 * 100 |
| Accessible 1.4 | @accessible_1__4 / 3 * 100 |
| Accessible 1.5 | @accessible_1__5 / 3 * 100 |
| Accessible 2 | ((@accessible_2__1 + @accessible_2__2 + @accessible_2__3 + @accessible_2__4 + @accessible_2__5) / 15) * 100 |
| Accessible 2.1 | @accessible_2__1 / 3 * 100 |
| Accessible 2.2 | @accessible_2__2 / 3 * 100 |
| Accessible 2.3 | @accessible_2__3 / 3 * 100 |
| Accessible 2.4 | @accessible_2__4 / 3 * 100 |
| Accessible 2.5 | @accessible_2__5 / 3 * 100 |
| Accessible 3 | ((@accessible_3__1 + @accessible_3__2 + @accessible_3__3 + @accessible_3__4 + @accessible_3__5) / 15) * 100 |
| Accessible 3.1 | @accessible_3__1 / 3 * 100 |
| Accessible 3.2 | @accessible_3__2 / 3 * 100 |
| Accessible 3.3 | @accessible_3__3 / 3 * 100 |
| Accessible 3.4 | @accessible_3__4 / 3 * 100 |
| Accessible 3.5 | @accessible_3__5 / 3 * 100 |
| Accessible 4 | ((@accessible_4__1 + @accessible_4__2 + @accessible_4__3 + @accessible_4__4 + @accessible_4__5) / 15) * 100 |
| Accessible 4.1 | @accessible_4__1 / 3 * 100 |
| Accessible 4.2 | @accessible_4__2 / 3 * 100 |
| Accessible 4.3 | @accessible_4__3 / 3 * 100 |
| Accessible 4.4 | @accessible_4__4 / 3 * 100 |
| Accessible 4.5 | @accessible_4__5 / 3 * 100 |
| Accessible 5 | ((@accessible_5__1 + @accessible_5__2 + @accessible_5__3 + @accessible_5__4 + @accessible_5__5) / 15) * 100 |
| Accessible 5.1 | @accessible_5__1 / 3 * 100 |
| Accessible 5.2 | @accessible_5__2 / 3 * 100 |
| Accessible 5.3 | @accessible_5__3 / 3 * 100 |
| Accessible 5.4 | @accessible_5__4 / 3 * 100 |
| Accessible 5.5 | @accessible_5__5 / 3 * 100 |
| Accessible 6 | ((@accessible_6__1 + @accessible_6__2 + @accessible_6__3 + @accessible_6__4 + @accessible_6__5) / 15) * 100 |
| Accessible 6.1 | @accessible_6__1 / 3 * 100 |
| Accessible 6.2 | @accessible_6__2 / 3 * 100 |
| Accessible 6.3 | @accessible_6__3 / 3 * 100 |
| Accessible 6.4 | @accessible_6__4 / 3 * 100 |
| Accessible 6.5 | @accessible_6__5 / 3 * 100 |
| Reliable 1 | ((@reliable_1__1 + @reliable_1__2 + @reliable_1__3 + (3 - @reliable_1__4) + @reliable_1__5) / 15) * 100 |
| Reliable 1.1 | @reliable_1__1 / 3 * 100 |
| Reliable 1.2 | @reliable_1__2 / 3 * 100 |
| Reliable 1.3 | @reliable_1__3 / 3 * 100 |
| Reliable 1.4 | (3 - @reliable_1__4) / 3 * 100 |
| Reliable 1.5 | @reliable_1__5 / 3 * 100 |
| Reliable 2 | ((@reliable_2__1 + @reliable_2__2 + @reliable_2__3 + @reliable_2__4 + @reliable_2__5) / 15) * 100 |
| Reliable 2.1 | @reliable_2__1 / 3 * 100 |
| Reliable 2.2 | @reliable_2__2 / 3 * 100 |
| Reliable 2.3 | @reliable_2__3 / 3 * 100 |
| Reliable 2.4 | @reliable_2__4 / 3 * 100 |
| Reliable 2.5 | @reliable_2__5 / 3 * 100 |
| Reliable 3 | ((@reliable_3__1 + @reliable_3__2 + @reliable_3__3 + @reliable_3__4 + @reliable_3__5) / 15) * 100 |
| Reliable 3.1 | @reliable_3__1 / 3 * 100 |
| Reliable 3.2 | @reliable_3__2 / 3 * 100 |
| Reliable 3.3 | @reliable_3__3 / 3 * 100 |
| Reliable 3.4 | @reliable_3__4 / 3 * 100 |
| Reliable 3.5 | @reliable_3__5 / 3 * 100 |
| Reliable 4 | ((@reliable_4__1 + @reliable_4__2 + @reliable_4__3 + @reliable_4__4 + @reliable_4__5) / 15) * 100 |
| Reliable 4.1 | @reliable_4__1 / 3 * 100 |
| Reliable 4.2 | @reliable_4__2 / 3 * 100 |
| Reliable 4.3 | @reliable_4__3 / 3 * 100 |
| Reliable 4.4 | @reliable_4__4 / 3 * 100 |
| Reliable 4.5 | @reliable_4__5 / 3 * 100 |
| Reliable 5 | ((@reliable_5__1 + @reliable_5__2 + @reliable_5__3 + @reliable_5__4 + @reliable_5__5) / 15) * 100 |
| Reliable 5.1 | @reliable_5__1 / 3 * 100 |
| Reliable 5.2 | @reliable_5__2 / 3 * 100 |
| Reliable 5.3 | @reliable_5__3 / 3 * 100 |
| Reliable 5.4 | @reliable_5__4 / 3 * 100 |
| Reliable 5.5 | @reliable_5__5 / 3 * 100 |
| Reliable 6 | ((@reliable_6__1 + @reliable_6__2 + @reliable_6__3 + @reliable_6__4 + @reliable_6__5) / 15) * 100 |
| Reliable 6.1 | @reliable_6__1 / 3 * 100 |
| Reliable 6.2 | @reliable_6__2 / 3 * 100 |
| Reliable 6.3 | @reliable_6__3 / 3 * 100 |
| Reliable 6.4 | @reliable_6__4 / 3 * 100 |
| Reliable 6.5 | @reliable_6__5 / 3 * 100 |
| Reliable 7 | ((@reliable_7__1 + @reliable_7__2 + @reliable_7__3 + @reliable_7__4 + @reliable_7__5) / 15) * 100 |
| Reliable 7.1 | @reliable_7__1 / 3 * 100 |
| Reliable 7.2 | @reliable_7__2 / 3 * 100 |
| Reliable 7.3 | @reliable_7__3 / 3 * 100 |
| Reliable 7.4 | @reliable_7__4 / 3 * 100 |
| Reliable 7.5 | @reliable_7__5 / 3 * 100 |
| Specialized Analyses | |
| Overall Quality | ((@accountable_5__1 + @accountable_5__2 + @accountable_5__3 + (3-@accountable_5__4) + @accountable_5__1 + @reliable_2__1 + @reliable_2__3+ @reliable_3__1 + @reliable_3__2 + @reliable_3__3 + @reliable_3__5 + @reliable_4__1 + @reliable_4__2 + @reliable_4__3 + @reliable_4__4 + @reliable_4__5 + @accessible_3__1 + @accessible_3__2 + @accessible_3__3 + @accessible_3__4 + @accessible_3__5) / 63) * 100 |
| Regulation Quality | ((@accountable_5__1 + @accountable_5__2 + @accountable_5__3 + @accountable_5__4 + @accountable_5__5)/15)*100 |
| Health Workforce Competence | ((@reliable_2__1 + @reliable_2__3 + @reliable_2__4 + @reliable_2__5)/12)*100 |
| Accreditation Quality | ((@reliable_3__1 + @reliable_3__2 + @reliable_3__3 + @reliable_3__4 + @reliable_3__5)/15)*100 |
| Commodity Quality | ((@reliable_4__1 + @reliable_4__2 + @reliable_4__3 + @reliable_4__4 + @reliable_4__5)/15)*100 |
| Quality Standards | ((@accessible_3__1 + @accessible_3__2 + @accessible_3__3 + @accessible_3__4 + @accessible_3__5)/15)*100 |
| Quality Improvement Processes | ((@accessible_3__1 + @accessible_3__2 + @accessible_3__3)/9)*100 |
| Community Demand Quality | ((@accessible_3__4 + @accessible_3__5)/6)*100 |
| Overall Equity | ((((@accessible_6__2 + @accessible_6__5)/6)*100) +(((@accessible_6__1 + @accessible_6__3 + @accessible_6__4)/9)*100))/2 |
| Gender Equity in Health Workforce | ((@accessible_6__2 + @accessible_6__5)/6)*100 |
| Health Equity | ((@accessible_6__1 + @accessible_6__3 + @accessible_6__4)/9)*100 |
| Overall Resilience | (((((3-@reliable_1__4) + @reliable_1__5 + @reliable_5__4+ @accessible_5__5 + @accessible_4__3)/15)*100)+(((@accessible_4__1 + @accessible_4__2 + @accessible_4__3 + @accessible_4__4 + @accessible_4__5 )/15)*100)+(((@reliable_7__1 + @reliable_7__2 + @reliable_7__3 + @reliable_7__4 + @reliable_7__5 )/15)*100)+(((@reliable_5__1 + @reliable_5__3 + @reliable_5__5)/9)*100))/4 |
| Safety in Emergency | ((@reliable_5__1 + @reliable_5__3 + @reliable_5__5)/9)*100 |
| Care Continuity in Crisis | ((@reliable_7__1 + @reliable_7__2 + @reliable_7__3 + @reliable_7__4 + @reliable_7__5 )/15)*100 |
| Emergency Care | ((@accessible_4__1 + @accessible_4__2 + @accessible_4__3 + @accessible_4__4 + @accessible_4__5 )/15)*100 |
| Surveillance | (((3-@reliable_1__4) + @reliable_1__5 + @reliable_5__4+ @accessible_5__5 + @accessible_4__3)/15)*100 |
| Overall Responsiveness | (((@accountable_1__1 + @accountable_1__2 + @accountable_1__3 + @accountable_1__4 + @accountable_1__5)/15)*100+((@accountable_6__1 + @accountable_6__2 + @accountable_6__3+(3-@accountable_6__4) + @accountable_6__5)/15)*100+((@affordable_1__1 + @affordable_1__2 + @affordable_1__3+(3-@affordable_1__4)+(3-@affordable_1__5))/15)*100+((@accessible_6__1 + @accessible_6__2 + @accessible_6__3 + @accessible_6__4 + @accessible_6__5)/15)*100+((@reliable_2__1 + @reliable_2__2 + @reliable_5__1 + @reliable_5__2)/12)*100)/5 |
| Stakeholder Oversight Collaboration | ((@accountable_1__1 + @accountable_1__2 + @accountable_1__3 + @accountable_1__4 + @accountable_1__5)/15)*100 |
| Recourse Options | ((@accountable_6__1 + @accountable_6__2 + @accountable_6__3+(3-@accountable_6__4) + @accountable_6__5)/15)*100 |
| Financial Protection | ((@affordable_1__1 + @affordable_1__2 + @affordable_1__3+(3-@affordable_1__4)+(3-@affordable_1__5))/15)*100 |
| Respectful Care | ((@accessible_6__1 + @accessible_6__2 + @accessible_6__3 + @accessible_6__4 + @accessible_6__5)/15)*100 |
| Safety and Regulation | ((@reliable_2__1 + @reliable_2__2 + @reliable_5__1 + @reliable_5__2)/12)*100 |
| Overall Client Trust | ((((@accountable_2__1 + @accountable_2__2 + @accountable_2__3 + @accountable_2__4+(3-@accountable_2__5))/15)*100)+(((@accountable_4__1 + @accountable_4__2 + @accountable_4__3)/9)*100)+(((@accessible_4__1 + @accessible_4__2 + @accessible_4__3)/9)*100)+(((@reliable_6__1 + @reliable_6__2 + @reliable_6__3 + @reliable_6__4 + @reliable_6__5)/15)*100))/4 |
| Client Privacy | ((@accountable_2__1 + @accountable_2__2 + @accountable_2__3 + @accountable_2__4+(3-@accountable_2__5))/15)*100 |
| Client Behavior and Outcomes | ((@accountable_4__1 + @accountable_4__2 + @accountable_4__3)/9)*100 |
| Emergency Transportation | ((@accessible_4__1 + @accessible_4__2 + @accessible_4__3)/9)*100 |
| Trust Healthcare Institutions | ((@reliable_6__1 + @reliable_6__2 + @reliable_6__3 + @reliable_6__4 + @reliable_6__5)/15)*100 |
| Overall Community Participation | (((@accountable_1__1 + @accountable_1__2 + @accountable_1__3)/9)*100+((@accessible_4__4 + @accessible_5__3 + @accessible_6__3 + @reliable_3__4)/12)*100)/2 |
| Community Oversight | ((@accountable_1__1 + @accountable_1__2 + @accountable_1__3)/9)*100 |
| Community Contribution | ((@accessible_4__4 + @accessible_5__3 + @accessible_6__3 + @reliable_3__4)/12)*100 |
| Overall Demand Generation | ((((@accessible_1__2 + @accessible_5__1 + @accessible_5__2 + @accessible_5__3)/12)*100)+(((@accountable_4__1 + @accountable_4__2)/6)*100))/2 |
| Education | ((@accessible_1__2 + @accessible_5__1 + @accessible_5__2 + @accessible_5__3)/12)*100 |
| Counselling | ((@accountable_4__1 + @accountable_4__2)/6)*100 |
| Overall Supply Side Strength | (((((3-@affordable_2__3) + @affordable_2__4 + @affordable_2__5)/9)*100) + (((@accessible_1__1 + @accessible_1__2 + @accessible_1__3 + @accessible_1__4 + @accessible_1__5)/15)*100) +(((@accessible_2__1 + @accessible_2__2 + @accessible_2__3 + @accessible_2__4 + @accessible_2__5)/15)*100)+(((@accessible_1__3 + @reliable_1__1 + @reliable_1__2)/9)*100))/4 |
| Cost Reasonableness | (((3-@affordable_2__3) + @affordable_2__4 + @affordable_2__5)/9)*100 |
| Access for Geographically Vulnerable Populations | ((@accessible_1__1 + @accessible_1__2 + @accessible_1__3 + @accessible_1__4 + @accessible_1__5)/15)*100 |
| Alternative Care Options | ((@accessible_2__1 + @accessible_2__2 + @accessible_2__3 + @accessible_2__4 + @accessible_2__5)/15)*100 |
| Staff and Supplies Availability | ((@accessible_1__3 + @reliable_1__1 + @reliable_1__2)/9)*100 |
| Overall Public Sector Involvement | (((((3-@affordable_2__1)+(3-@affordable_2__4) + @affordable_4__1 + @affordable_4__2 + @affordable_4__3+ @affordable_5__1)/18)*100)+ (((@affordable_1__1 + @affordable_1__4)/6)*100))/2 |
| Public Sector Role | (((3-@affordable_2__1)+(3-@affordable_2__4) + @affordable_4__1 + @affordable_4__2 + @affordable_4__3+ @affordable_5__1)/18)*100 |
| Public Financing | ((@affordable_1__1 + @affordable_1__4)/6)*100 |
| Overall Private Sector Involvement | ((((@accountable_1__5 + @affordable_1__2+(3-@affordable_2__2) + @affordable_3__1 + @affordable_3__2 + @affordable_3__3)/18)*100)+ (((@affordable_4__4 + @affordable_4__5)/6)*100))/2 |
| Private Sector Role | ((@accountable_1__5 + @affordable_1__2+(3-@affordable_2__2) + @affordable_3__1 + @affordable_3__2 + @affordable_3__3)/18)*100 |
| Private Supplemental Health Financing | ((@affordable_4__4 + @affordable_4__5)/6)*100 |
| Protection Schemes | ((@affordable_3__1 + @affordable_3__2 + @affordable_3__3 + @affordable_3__4 + @affordable_3__5)/15)*100 |
| Multi Sector Collaboration | ((@reliable_1__3 + @reliable_1__5 + @reliable_7__4 + @reliable_7__5)/12)*100 |
| Health Information System Strength | (((3-@accountable_3__1) + @accountable_3__2 + @accountable_3__3 + @accountable_3__4 + @accountable_3__5 + @accessible_5__5)/18)*100 |
| Health Workforce Management | (((3-@accountable_4__4) + @accountable_4__5 + @reliable_1__1)/9)*100 |
| Management Committees at Different Levels | ((@accessible_6__3 + @accountable_6__3 + @accountable_1__3)/9)*100 |
| Commodity Cost | ((@affordable_5__1 + @affordable_5__2 + @affordable_5__4 + @affordable_5__5)/12)*100 |
| Logistics/Supplies | ((@reliable_5__3 + @reliable_5__5 + @reliable_1__2)/9)*100 |
| Pharmaceutical Regulation | ((@reliable_4__1 + @reliable_4__2 + @reliable_4__3 + @reliable_4__4 + @reliable_4__5)/15)*100 |
Appendix B: Use of convenience sampling
Convenience sampling implementation
To find an estimate of the object of interest, which allows informed management decision-making with 10-15% error rate, the literature cited below showed that a sample size of 30 would be cost effective to give us reliable estimates. As noted in usability and repeated observations in literature, a sample of 8 respondents will calculate a reliable estimate of the object of interest. However, to get more confidence in convenience sample results, increase the representation of the various groups within the target population. Therefore, we suggest including at least four groups of organizations (public, private sector, NGO/CSOs/community leaders, and international organizations) in the sample, which will give a total sample of 32 (=4*8).
Suggested steps but amenable to adaptation according to specific situations
Step 1: Create a list of the public, private sector, NGO/CSOs/community leaders, and international organizations.
Step 2: Select a minimum of 32 respondents but assuming that 50% will not respond, it is better to send the tool to 48 respondents to account for non-response
Step 3: Randomly select four organization under each group of organization – 1) public; 2) private sector, 3) NGO/CSOs/community leaders; and 4) international organizations. Public sector/Ministry is one organization or administrative unit. One way to separate it is to use departments, regional or district offices or semi-governments institution such as drug regulatory authority, Institute of health, etc. This step will provide 16 (4*4) organizations. If we request 3 respondents from each organization, the total sample will be 48.
Step 4: Invite the selected organization to participate in the survey describing goal and objectives. Organization(s) that decline to participate replace them with other organizations from the existing list.
Step 5: Send the tool link to the participating organization heads to share the link randomly with three organizational members; preferably one member at the central level, and two members at the peripheral level from different parts of the country. Inform the participants that aggregated data will be available in real time for them to view and use.
Step 6: Where possible, organize a meeting with all stakeholders to discuss HPHC data implications and plan of action.
Step 7: We recommend for tracking progress over time to repeat the survey semi-annually but definitely at yearly intervals.
Rationale for using convenience sampling and sample size
Convenience sampling is a useful method for collecting data when the resources are limited. Convenience sampling is a dominant method for collecting reliable and valid information in the development field such as the World Bank Governance indicators1 and Country Policy and Institutional Assessment tool2 or Transparency International Corruption Perception Index 2020. The results of non-probability sampling are comparable to probability sampling when all stakeholders in the target populations are represented and respondents’ socio-demographic characteristics do not influence the responses3,4,5,6,7.
Convenience sampling provides reliable results, and the question arises, what is the appropriate small sample size for reliable and valid estimates? The sample size calculation is guided by the following three schools of thought:
The literature on usability test8,9,10,11,12 states that the problems could be identified by first 3 to 5 users given higher prevalence of the problem and adding more respondents does not improve estimation. However, these authors also suggested adjustment to the sample size formula for increased reliability. There seems to be a consensus that the sample size of 7-8 respondents provides 90% probability that the estimates are reliable.
Small sample size is also dealt with in literature on repeated observations for reducing intra-patient variability and improving statistical power. What should be the number of repeated observations to reduce intra-client variability to get a reliable estimate of the object of interest? Vickers13 provided a formula and concluded that there is little value in increasing the number of either baseline or post treatment assessments beyond six or seven repeat observations.
A simple rule of thumb is that a sample of >30 is needed for reliable results because the 30 or more respondents tend to create a normal distribution which approximates a z distribution. Green and Sandomire14 showed that the permissible error of the estimate from an absolute to a relative one can permit an exact, a priori solution to the problem of sample size. They showed that an error rate of +10% with confidence of 80% could be obtained with a sample size of 30.
The suggested sample size of 30 could also be used to test hypothesis with t-distribution as well.
Appendix C: Use of probability sampling
To get a precise estimate of the HPHC performance score with a small sample size, we suggest using Lot Quality Assurance Sampling (LQAS), which has become mainstreamed in public health in the last 20 years15,16,17 . The sample size formula18 requires only 96 (rounded to 100) respondents, who are randomly selected. These respondents are equally divided into areas or lots, which may be based on the administrative boundaries or some other criteria. Equally divided means 20 respondents under each area. Quality Assurance Sampling is a form of stratified sampling4. Therefore, lots/administrative area respondents could be added together to get an overall sample.
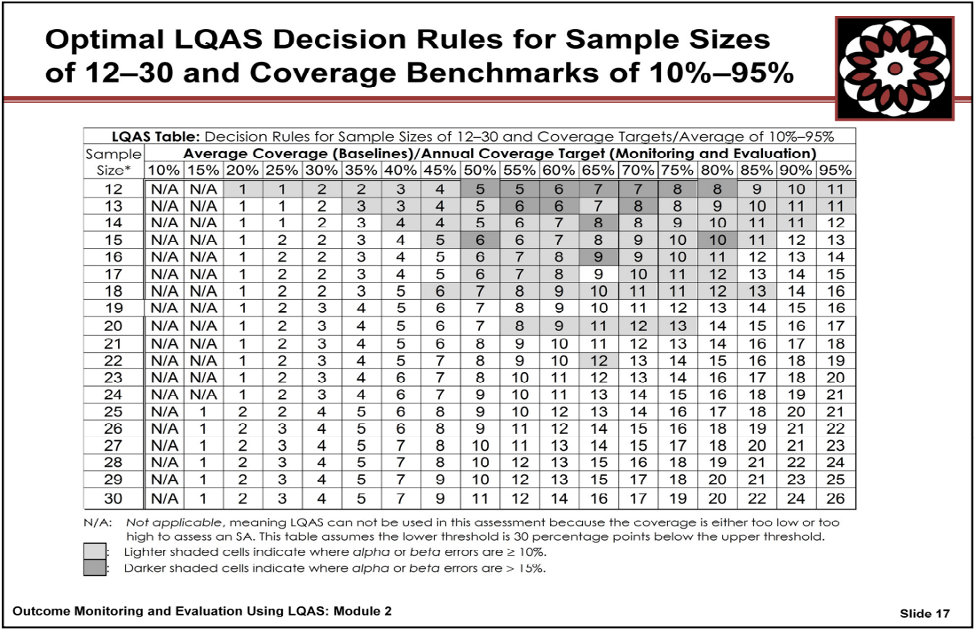
Another advantage of LQAS is that one can assess whether certain targets are reached with a sample size of only 19. For example, testing whether the Accountable care is meeting an 80% score or the quality processes functionality score achieve a target of 70%. The use of LQAS along with HPHC tool could answer these types of questions.
Steps required to use LQAS at national or regional levels
1. Divide the country or region into five areas/lots.
2. Select two districts randomly per administrative areas to have 10 respondents per district.
3. Within each district, use lists of private, public, non-government and international organizations and community leaders related to the development or health fields. You need only two people from each group of organization to have the required 10 respondents.
4. Send the link to the head of the organization to share with HPHC tool with staff. Note: the staff responses are not shared with anyone and aggregated results are presented to keep the privacy and confidentiality of the respondents.
Steps required to use LQAS at district level
Some organizations might want to assess the health system performance at the district level. The steps are the same except that district need to be divided into five administrative units or areas. The selection of the respondents is random.
Testing achievement of HPHC score targets
The following steps could help in testing hypotheses related to achievement or compliance with a set target or standard.
1. Set a target to achieve e.g., 80% accessible care
2. Use a sample of 19 respondents to have higher confidence in result
3. Use the table19 below to select what number correspond to the target achievement. For this example of 80% target achievement, that number correspond to at least 13 respondents perceiving that care is accessible
4. Send the link to tool to the 19 random respondents in the areas of interest
5. See the analysis and visualization score to assess whether the target was achieved
Frequently Asked Questions (FAQs)
Levels of Analysis
Can the tool be used at a program level or is it only intended to be used at the state or national level?
The tool is not intended to be used to assess the performance of single programs within the health system (HIV/AIDS program, malaria program, MCH program, etc.) or individual organizations because it measures the overall health system performance.
The tool can be used at the program/project level for programs working on health systems strengthening by defining project catchment areas, which may be regions or districts. When used by an individual project, the tool should still be shared with relevant suggested organizations (from the public, private sector, NGOs and international organizations) in the catchment areas.
Ultimately the tool can be used at different levels of the health system and can be used by different organizations within a single health system (understanding that those organizations are assessing overall health system performance). When multiple organizations within a country use the tool, their information will be available in the public domain and as appropriate information from different organizations will be combined and aggregated for national or state level analyses.
Is there a limit to the number of people from a single organization that can use the tool?
The tool was not designed to assess organizational performance, it was designed to assess health system performance. The data in the tool is most robust with representation from people working in the public, private sector, NGOs and international organizations rather than more individuals from one organization which would not reflect representation from people working in different types of organization.
Ultimately, the tool results should reflect respondents from a diverse set of organization types (public, private, NGOs and international organizations).
In order to get an accurate baseline of country performance, we recommend a minimum of 4 organizations under each organization type, with at least 2 respondents per organization. Across this sample frame, individual respondents within the organizations should come from different regions or levels of the system. If this level of representation is achieved, additional respondents within and across organizations will increase the overall precision of the results. See details higher up in this page for the recommended sampling approach and calculating sample size for more precise estimations.
Interpretation of Results
How does this tool use and include prior tools developed for health systems benchmarking such as the USAID- Health systems benchmarking tool that was launched in 2015-2016?
The HPHC tool complements other tools supported by USAID. Each tool serves a specific purpose and is used for that purpose. The HPHC tool is primarily used to understand the overall performance of the health system, to recognize and capture the multidimensionality of UHC and to measure strengths and weaknesses in a health system’s ability to deliver health care.
How can the information from this tool be compared (or to what extent can it be compared) to standard country information data sources? But also with other global measurement tools (e.g., PHCPI, HSA etc.)?
Because health systems themselves are complex and interrelated, so is the information about those health systems. This tool is meant to be complementary to other sources of information on a health system to help provide a more comprehensive picture. Because the tool is a low cost option, data from this tool may be available on a more regular basis than information from other sources. Decision making on health systems interventions and improvement should always be based on multiple perspectives and different data sources contribute to this.
If there is little to no data available on a country’s health system, how might this tool be useful?
The tool is meant to help fill a gap in the availability of data on a country’s health system. Its reliability and validity has already been tested in low and middle income countries verifying its ability to collect data that is aligned to the results seen from other sources of quantitative health systems data. Therefore, the tool can provide reliable and valid information about health systems in countries without recent availability of other sources of information. Additionally, since the tool is based on perceptions, respondents do not need to access quantitative data about the health system to answer the questions.
The few questions that were mentioned in the tool for affordability & accessibility seem subjective. Will this affect the validity of comparing different countries & regions?
All questions in the tool are subjective as they collect perceptions about AAAR domains. However, these perceptions provide a good estimate on the functionality of the existing processes related to health system functions, outcomes like quality, equity, stakeholders’ involvement etc. Further, gaps in perceptions of the respondents and objective reality reflect blind spots that need to be addressed as the whole of the society is responsible for improving the health system and better outcomes. If perceptions about health systems are not similar across different groups of people in the society then they may reflect discourse and may need to be addressed that the health system caters for everyone needs.
Is this a qualitative tool? Can it be used to see differences in perceptions at different levels of the same health system?
No, it is a quantitative tool that collects qualitative (perceptions) information about health system performance, processes, and outcomes.
Yes, the tool can be used to observe differences in perceptions at different levels of the health system. However, you need to adjust your sample size to allow comparisons among different levels of the health system.
Does the tool allow for users to enter qualitative information in each domain?
The tool does not provide for qualitative information to be added as the tool is being filled out.
USAID encourages countries or organizations who have used the tool involving different stakeholders to invite them for a stakeholder meeting to review and interpret results in order to decide how to act to improve the information. It is at this stage that additional qualitative information from the different stakeholders can be considered and added to the analysis.
When computing domains and overall scores of the tool are you assuming that all sub components for a given domain and all four domains have the same weight? if so, is it realistic to think so?
Yes. Each sub component for a given domain has equal weight because they are all considered important. Currently there is no evidence to concretely suggest alternative weighing. Once we have data from different countries which start identifying critical indicators, then we will adjust that in calculations in the future. However, organizations requesting data sets could conduct analyses assigning their own weights. This is one example of how further use and analysis of data in the tool might contribute to advancing an overall understanding of what it takes to achieve a high performing health care system.
Will USAID and the CHISU project use the data for cross-sectional analysis? If so, how will that data be used?
The data (which does not include personal identifiers, as they are not collected via the tool) is available to any credible organization or academic institution for further analysis. Our goal is to provide access to a robust database on health systems globally to help advance understanding of health systems strengthening. We also provide immediate data visualization on health system performance trends and underlying system processes and outcomes.
How quickly do you expect to see meaningful trends in data?
Observing meaningful trends in data will depend upon multiple factors in a given country, including whether multiple organizations use the tool with nationally representative sampling. We encourage individual countries/organizations to create a baseline and use the tool repeatedly (every 6 months to annually) to observe changes over time.
Trends can also be used to measure responses to specific health systems activities through pre-post testing use of the tool.
As the tool is used and more data is generated, we expect to learn more about what to expect regarding trends, and how quickly indicators move over time or respond to interventions designed to impact the variables.
Dissemination
How and when would an implementation project decide or expect to use this tool? For example, would a project use it if requested by USAID or another donor?
An implementation project, organization, donor or other entity can decide to use the tool at any time. Any entity that uses the tool should seek to achieve wide representation through their users to cover multiple organization types. USAID plans to actively encourage its use through multiple channels. As more organizations use the tool the richer the information will be both within and across countries.
How will USAID get a wide number of stakeholders to enter and use the data?
We will encourage various stakeholders through different networks with the intent to raise awareness and encourage use across public, private sector, NGOs/CSOs and international organizations to populate the HPHC database. This will create baseline data for countries and repeated use will help to observe trends in HPHC scores by countries over time.
Is USAID collaborating with WHO in the promotion and use of the tool?
We will collaborate with all international, bilateral and multilateral organizations and donors to promote the tool. We assume as the HPHC global database is populated providing useful information for planning, management and monitoring, it will also generate its own demand.
Methodology
Contact aaqil@usaid.gov to discuss more specific details on sampling and sample size
Is a sample size of 30 sufficient to be able to disaggregate the findings by public/private, male/female, etc. as was shown in the results?
The objective of using a sample size of 30 is to assess the overall High Performing Health Care (HPHC) and accountability, affordability, accessibility and reliability domain scores.
Please note that the sample size of 30 respondents from four types of organizations is not suggested for finding significant differences by respondents characteristics but to increase representation for a variety of voices from public, private, NGOS and international organizations. It is better to use Lot Quality Assurance Sampling (LQAS) with a sample of 100 (5 lots and 20 random respondents under each lot). See Appendix C (above) on LQAS sampling.
Is a sample size of 30 for a single country independent of the size of the country?
Yes a sample size of 30 is sufficient regardless of the size of the country. The sample size of 30 is determined by usability and repeated observation literature which states that a sample of 8 respondents' responses or repeated observations tend to approximate normal distribution. However, such convenience sampling requires a diverse group of respondents for better representation to protect against biased results. Therefore, we suggested at least four groups of organizations be included in the sample which will give a sample of 32 (8*4). See guidance document for more detail on sampling and sample size.
What would be the sample size if I want to compare 14 regions in a country?
For more precise estimates and comparisons among different regions, the suggested sampling methodology is Lot Quality Assurance Sampling. Consider the region as a lot, which means you will select 20 respondents randomly under each lot. That will give a sample size of 280(14*20) respondents. Suggestions for randomly selecting these respondents are included in the Guidance document. See Appendix C (above) on LQAS sampling.
Should the tool be completed by service users, service providers, or both?
Both. Also health program or facility managers and planners. The tool should be used by a wide variety of stakeholders with knowledge of the system in order to get diverse perspectives and points of view.
Will the tool be made available offline so that it can be administered in regions with weak internet accessibility?
If the sample includes a variety of different organizations and stakeholders, the results will be valid at a national (or local level), even if it is limited to stakeholders with internet access.
Is there an app for the tool that can be downloaded to a tablet?
Since the tool is web based, you can access the tool using a phone or tablet if it is connected to the internet via wi-fi or cellular data.
How does USAID plan to ensure that the tool is maintained and updated beyond the duration of the project?
The CHISU project does not end until 2025. While the project is active, USAID hopes to refine and streamline the tool and the project will work to identify a permanent place for the tool so it can be maintained beyond the term of the project.